Econometrics: why co-integration is needed
i.e. probability that it is not stationary = 0.36%
Now a question for the forum members: so what? How can such a series be used? I have a whole collection on cointegration, but nothing on usage. If anyone has anything on this - please share.
If such a series is stationary and dependent on the euro-dollar, then look for patterns on it and trade on the euro-dollar
If such a series is stationary and dependent on the euro-dollar, then look for patterns on it and trade on the euro-dollar
Externally, it doesn't matter. The main thing is that there are general patterns. And if this new stationary series is derived from the euro-dollar series, then it means it is dependent on it, which means there may be general patterns.
On the surface, it doesn't matter. The main thing is that there are general patterns. And if this new stationary series is derived from the euro-dollar series, it means it is dependent on it, which means there may be general patterns.
What regression on levels has to do with it is unclear to me.
Taki, after three consecutive sentences, I'm back here, doing time, and the moderator who banned me is a radish, not a good man :o) ))
to faa
(1)
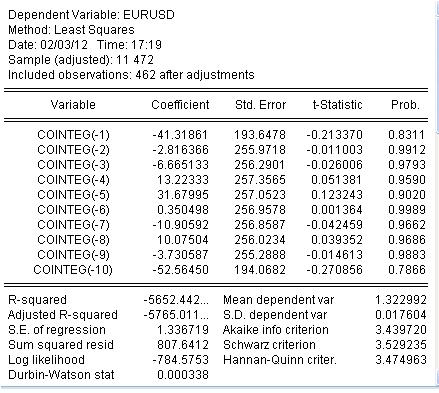
Your model stats are very shitty, starting with the coefficient size etc. That's understandable, to pull your eurik up by the ear you need to multiply by big numbers, which means you need a fucking accurate prediction, i.e. t-statistics doesn't really tell you anything (it should be ten times smaller), but just lies and again creates an illusion for you.
(2)
Further, what does "stationary" mean? In what sense? Stationary only the distribution or also the ACF? If only the former (stationarity in the narrow sense, not much use). You seem to take very seriously the figure determining the probability of stationarity. And most likely you have imaginary stationarity, the value of your sequence 0.0132-0.0137 frankly is a complete fake, it is clear that it will not go far away from your so-called "level", even if it really wants to, its coefficient will fail.
(3)
The presence of stationarity absolutely does not mean and does not equal predictability, everything is not so simple, a condition as if necessary, but not yet sufficient :o)
(4)
Your magic formula: cointeg = -eurusd + 119.3552 * REGRES_1 - 0.276233 - 2/112E-05*trend is bullshit. I'm not even going to explain it, I'm sick of it ...
(4)
You have two X's and one equation, i.e. you cannot pass to currencies. There is only one way out - complicate the model until there is no correlation or look for statistical dependencies.
...
but on your own:
Если у кого имеется что-либо по этому поводу - прошу поделиться.
There is always something to share:
... And in his inflamed mind wonderful visions began to swirl: there he was sailing on his own yacht, warm ocean waves gently rock the ship, from coral islands coconut palms waved their shaggy paws at him, and a chocolate naked mulatto was combing with a tortoise comb his lord Ippolit Matveyevich's luxurious moustache and subserviently looked into his eyes. Then the mulatto takes Vorobyaninov by the arm and together they jump overboard, swept by the warm waves to the magic shore. The mulatto runs forward, falls on the sand and holds out her hands, calling to him.
...
faa1947: вывод: не подгоняется, значит не зависят.
Now a question for forum members: so what? How can such a series be used?
- Free trading apps
- Over 8,000 signals for copying
- Economic news for exploring financial markets
You agree to website policy and terms of use
Attempts to overcome the non-stationarity of the quotient are undertaken all the time in econometrics. One such approach is the use of the cointegration property.
In 1987, Engle and Grainger suggested that the combination of two differentially stationary series (I(1)) is stationary, i.e. I(0). It seems to be an idiot's dream come true, but it's not clear how to use it.
I am able to find the third series, which is stationary at level, rather than its first difference, by two non-stationary series. But I don't understand how it can be used. Maybe someone can give me a hint.
So, let's begin.
We have a EURUSD H1 quotient of 472 bars - that's exactly 4 weeks.
The test of the unit root shows that the series is not stationary but its first difference is.
Taken another quotient - the dollar index:
We see that the two cointeg are very similar.
The unit root test for the dollar index also says that the series is not stationary, but the first difference of this series is stationary.
From these two series let's try to make a third series which is stationary in the level. i.e. we have to find some combination of these series, take into account the trend and shift.
The result is as follows:
Let us create a series according to the formula:
cointeg = -eurusd + 119.3552 * REGRES_1 - 0.276233 - 2/112E-05*trend
The series together with eurusd looks like:
There is nothing similar!
The new cointeg series derived from the two non-stationary series is stationary:
i.e. the probability that it is non-stationary = 0.36%.
Now a question for the forum members: so what? How can such a series be used? I have a whole collection on cointegration, but nothing on usage. If anyone has anything on this please share.