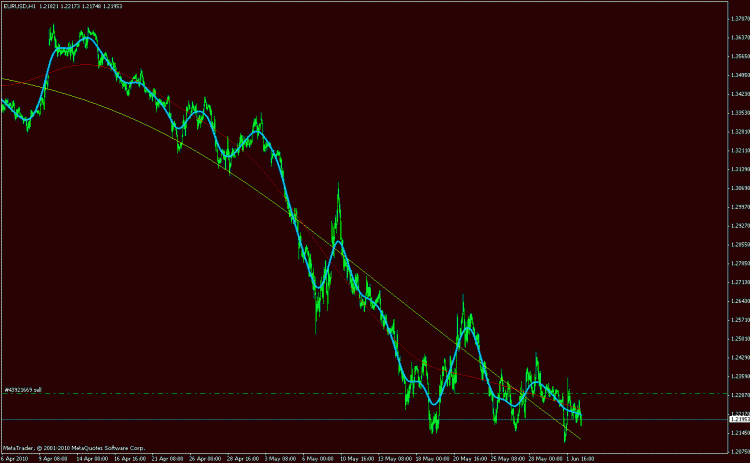
Is it OOS?
I don't do optimisation and have been tuning in pictures in the interval of only 1 day.
Why do I have the question? Working out TC I got used to similar results, but I can't get them stable and I don't know what to do with the above mentioned ones.
| Symbol | EURUSD (Euro vs US Dollar) | ||||
| Period | 30 Minutes (M30) 2010.04.26 00:00 - 2010.05.25 23:30 (2010.04.26 - 2010.05.26) | ||||
| Model | All ticks (most accurate method based on all smallest available timeframes) | ||||
| Parameters | Lot=0.1; MaxRisk=1; StopLoss=570; | ||||
| Bars in history | 2049 | Modelled ticks | 1155483 | Modeling quality | 90.00% |
| Chart mismatch errors | 19 | ||||
| Initial deposit | 1000.00 | ||||
| Net profit | 2422.49 | Total profit | 2449.95 | Total loss | -27.46 |
| Profitability | 89.22 | Expected payoff | 34.12 | ||
| Absolute drawdown | 18.80 | Maximum drawdown | 141.90 (4.67%) | Relative drawdown | 4.67% (141.90) |
| Total trades | 71 | Short positions (% win) | 33 (87.88%) | Long positions (% win) | 38 (94.74%) |
| Profitable trades (% of all) | 65 (91.55%) | Loss trades (% of all) | 6 (8.45%) | ||
| Largest | largest profitable trade | 234.20 | losing transaction | -8.10 | |
| Average | profitable deal | 37.69 | losing trade | -4.58 | |
| Maximum number | continuous wins (profit) | 34 (1337.94) | Continuous losses (loss) | 1 (-8.10) | |
| Maximum | Continuous Profit (number of wins) | 1337.94 (34) | Continuous loss (number of losses) | -8.10 (1) | |
| Average | continuous winnings | 11 | Continuous loss | 1 | |
In most cases, the range depends on the indicator(s) and how they react to changes in the market
That's understandable, my indicators are quite complicated and very sensitive to market changes, and I can't make an effective autotuning yet, so I tried to use a wizard, it's much more stable, but the results are not impressive.
Stability is defined by the ability of the system not to drain at unfavourable parts of the history for it. In other words, if the initial parameters are constant, we select the areas where the system leaks, look for the reason, try to overcome it, etc.
It's understandable, my indicators are quite complicated and very sensitive to market changes, and I can't make an effective autotuning yet, so I tried to use a wizard, which is much more stable, but the results are not impressive.
Look for a pattern. P.S. There really is one detail missing here :)
Stability is defined by the ability of the system not to drain at unfavourable parts of the history for it. In other words, if the initial parameters are constant, we select the areas where the system leaks, look for the reason, try to overcome it, etc.
My TC from post 1 contains only one waving, not several, which would give intersections.
- Free trading apps
- Over 8,000 signals for copying
- Economic news for exploring financial markets
You agree to website policy and terms of use


I made a lot of re-do's on my own complicated indicators, but one problem I could not overcome, TS show high efficiency, but on short intervals of history. I tried new and different strategies, trying to find a stable one in a wide range, but so far I haven't succeeded. I have decided to try the most primitive one with one mouse, the working range is much wider, but indicators are very low compared to previous versions. Question in the studio: Is there any prospect of finalizing such a TS, or according to the experience of experienced EA users, such a TS has no chance?
If MM is switched on, you get the following