Spread trading in Meta Trader - page 250
You are missing trading opportunities:
- Free trading apps
- Over 8,000 signals for copying
- Economic news for exploring financial markets
Registration
Log in
You agree to website policy and terms of use
If you do not have an account, please register
Useful information for lovers of seasonal spread trading. Below are excerpts from the latest seasonal review I wrote for Pantheon-Finance on grain instruments:
__________Grain__________________
According to analysts, US corn acreage will fall in 2014 for the first time in six years. This is due to the fact that American farmers are choosing other crops for cultivation - soybeans and wheat. The area of soybean fields planted will reach a record 83.6 million acres (33.82 million hectares), Informa Economics predicts. These figures are 6.4 million acres (2.6 million hectares) higher than the US Department of Agriculture estimates.
The area for wheat cultivation is estimated at 56.7 million acres (22.94 million ha), up from the official estimate of 56.5 million acres (22.86 million ha).
UK: Wheat production will be lower than last year despite a surge in yields.
Canada: Wheat harvested with low protein content. Jubilation over Canada's record wheat harvest proved premature as grain quality was not entirely satisfactory. Canada harvested its best spring wheat crop in 22 years in terms of tonnage. However, the protein content of the wheat was unremarkable.
The average protein level of spring red-grain wheat was 12.4%-13.2%. The best result in terms of protein content was recorded in the province of Manitoba, at 13.1%-14.1%. For comparison, in the USA the protein content of wheat reaches 18.6%. (Kazakh-grain news agency)
------------------
So, while wheat is rising, soybean prices are flat!
Meanwhile, from the first days of October there is an interesting seasonal pattern in spread soybeans - wheat! The spread is increasing - almost all of October!
Below is a graph of the averaged multi-year seasonal (3-5-10 year) trends of the specified spread ZSF4 - ZWZ3 = 1^1:
UP-movement of the spread is assumed until the end of October-month! The blue price line shows last year's (about +100 ticks) long-term seasonal movement of the instrument! Last year 2012 seasonal dynamics of spread purchases was observed, but still uneven and weak! In the MT4 trading platform you can take any available ZS-ZW contracts. For example - to estimate the anticipated seasonal movement, let's view the complete statistics of spread purchases ZSF4 - ZWH4 = 1^1, for example - from October 2 till October 31 of the last 13 years (not including the last year 2012):
Percentage of profitable trades (+10/-3) as well as the average profit/loss ratio (+195 ticks/-111 ticks, mind you, the grain scale in one is 4 ticks, 1 tick = $12.5) in the analyzed time frame looks quite satisfactory!
The ZS-ZW=1^1 spread is now (as it "should" be by September seasonality - see multi-year chart above) systematically declining! But from one day to the next, from the first days of October, we should "technically and fundamentally" look for the first signs of a possible UP reversal:
This spread, like virtually all intermarket spreads, is quite capricious and volatile. On small exchange deposits, you can use mini-contracts of the constituent grains to reduce the risk. This allows you to work comfortably, calmly, and without stress (even with topping up) on the spread! In this case, for example, in a well-known trading platform CQG, on entering (exiting) have to "manually" open (close) positions: BUY XB - SELL XW. The current spread analysis can be implemented, using well-known indicators, in a popular MT4 platform!
Good luck to all!
Полный текст: http://procapital.ru/showthread.php?t=41813&page=190&p=1532869&viewfull=1#post1532869
Useful information for lovers of seasonal spread trading. Below are excerpts from the latest seasonal review I wrote for Pantheon-Finance on soft instruments:
---------------------------------
Today let's start looking at October seasonal trends in orange juice futures contracts (ticker JO or OJ). And its calendar spread!
We've put ageneral annual overview on this instrument before on the Pantheon-Finance forum. See posts 737-738 in the address:
http://procapital.ru/showthread.php?t=41813&page=74&p=1309335#post1309335
-----------------------------
Just a reminder that OJ prices are currently being driven by the attention of stockbrokers to Florida crops. A summer drought in this region is generally of little concern as orange plantations in the state are well equipped with well-developed irrigation systems. However, autumn frosts can be a major concern here. To which Florida's current crop is very vulnerable. Frosts can usually occur from November to March. But from the end of the first decade of October onwards, anxious stock market participants start to play a higher game, which can be clearly seen in the multi-year (3, 5 and 10 year) seasonal trend curves:
(Construction of seasonal charts for commodity futures market instruments and their spreads are freely available at:
http://seasonal-traders.com/graphics/)
For now we will estimate the seasonality of the instrument till the mid-20th of this month. Because November 1 is the FND-expiration of the near-term contract. And we'd better not take it to an extreme and close the position a few days before that date! The blue price line shows a somewhat questionable performance of last year's OJ.
For a more specific estimation of supposed seasonal movement, let's look at the complete statistics of orange juice purchase, for example, from October 7 to October 23 for the last 13 years:
(Construction of seasonal statistics for commodity futures market instruments and their spreads are freely available at:
http://seasonal-traders.com/stats/#stat?ojx2013?2013-10-07?2013-10-23?Buy )
The percent of profitable trades (+9/-4), as well as the profit/loss averages (+235 ticks/-73 ticks, remember, on the OJ scale in unit - 20 ticks, 1 tick = $7.5) in the analyzed time interval look satisfactory enough! But the maximal drawdown is a bit too large. But here, apparently, it is possible to reduce the drawdown to a reasonable minimum, if we work in short-term (by our seasonal standards) purchases of the juice on a pullback of the price, using the means of a standard technical analysis on small (H1-H4) timeframes to determine the best entry/exit points.
For small market deposits is much more attractive single entry - looks closer calendar spread of orange juice, OJX3 - OJF4 (November 2013 - January 2014) Let's see a graph of the average multi-year (3, 5 and 10 years) seasonal trends in the specified spread:
Nal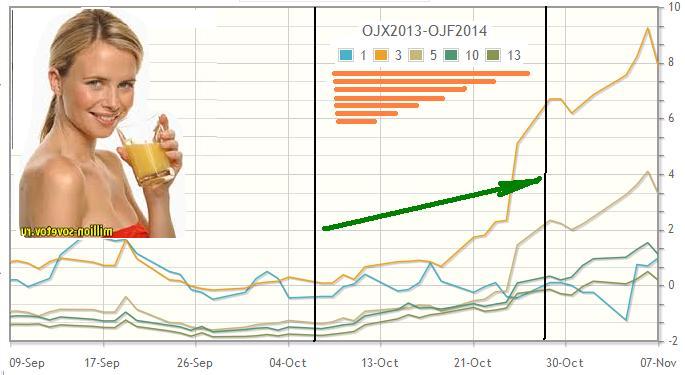
Similarly (as for the single instrument) let's take the UP-seasonal spread to the mid-20th of the current month. The averaged lines look promising! The blue price line shows last year's performance. Which, albeit somewhat awkwardly, but still took place with a small profit!
As always, for a more specific assessment of the intended seasonal movement, let's look at the complete statistics for orange juice OJX3-F4 spread buying, for example, from October 7 to October 23 for the last 13 years:
http://seasonal-traders.com/stats/#stat?OJX2013-OJF2014?2013-10-07?2013-10-23?Buy
The statistics are not bad! The percentage of profitable trades (+9/-4) as well as the average profit/loss ratio (+30 ticks/-8 ticks) in the analyzed timeframe look very attractive! Especially for low-risk trading on small trading deposits!
Wrapping up the orange juice review!
 [img]http://img-fotki.yandex.ru/get/4902/16794745.8/0_c1602_1cf04f2b_XL.jpg[/img]
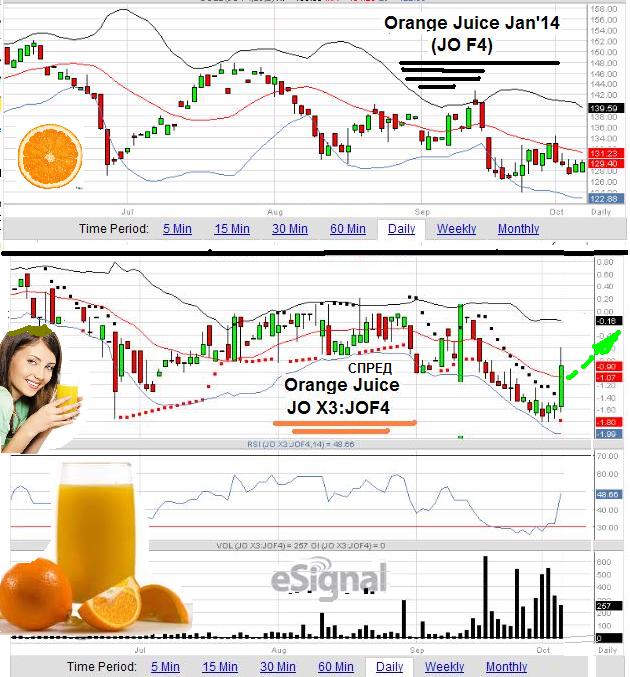
The current situation for the near single contract and spread is shown in the charts:
While the single contracts are still in no hurry to go up, the OJX3-F4 spread moved up noticeably on Friday just before the end of trading - by a dozen to a half ticks! We are waiting for the further movement next week!
Let me remind you that OJ trades start in the afternoon Moscow time zone.
Source: http: //procapital.ru/showthread.php?t=41813&page=193
The starting contraption has doubled in a dozen trades! It's time for the real...
One.
Two.
Useful information for lovers of seasonal spread trading. Below are excerpts from the last seasonal review I wrote for Pantheon-Finance on commodities:
source http://procapital.ru/showthread.php?t=41813&page=222
---------------------------------
Raw materials in November, part 3
.... As for the calendar spreads for northern European Brent crude, the seasonality has been diametrically opposed since the second decade of November! This is confirmed by the graphs of the averaged multi-year seasonal trends (3-5-10-year) of calendar spreads BRNF4-G4 and BRNF4-H4:
Spreads are rising until the last days of November! Here, last year's performance of the instruments (shown by the blue price line), unlike the Light Sweat oil spread discussed earlier - was quite confident!
For a more specific assessment of the perceived seasonal movement, let's look at the full BRNF4-G4 buying statistics for the last 13 years to the last days of this month:
http://seasonal-traders.com/stats/#stat?BRF2014-BRG2014?2013-11-15?2013-11-27?Buy
The percentage of profitable trades(+8/-4), as well as the average profit/loss ratio(+17 ticks/-12 ticks, 1 tick = $10) in the analyzed time interval looks satisfactory enough even for the realization of entry on small stock deposits!
Those who want to gain more profit, for the second leverage may use a farther oil contract, for example March. Statistics of such entry (BUY BRNF4-H4) in the same time interval is presented in the address:
http://seasonal-traders.com/stats/#stat?BRF2014-BRH2014?2013-11-15?2013-11-27?Buy
There you can also see the annual spread charts for the last 13 years (the most recent buttons in the table are in the "Chart" column).
It is clear that the risk of possible drawdowns is somewhat higher here!
Back to the close spread! The spread has been rising for a few days now. The current situation for the BRNF4-G4 spread is shown in the candlestick Daily chart below:
Assuming to work here with limiters to buy on pullbacks with small targets. Right in the stack, setting a takeprofit from +7 or 8 ticks. Thus, it may be possible to take profit 2-3 times on this seasonal movement.
Good luck to all!
Useful information for lovers of seasonal spread trading. Below are excerpts from the latest seasonal review I wrote for Pantheon-Finance on inetals:
----------------------------------
... Let me remind you that from the last decade of November after the seasonal decline - a long-term UP-trend of copper contracts begins! Which is expected until the first days of February next year!
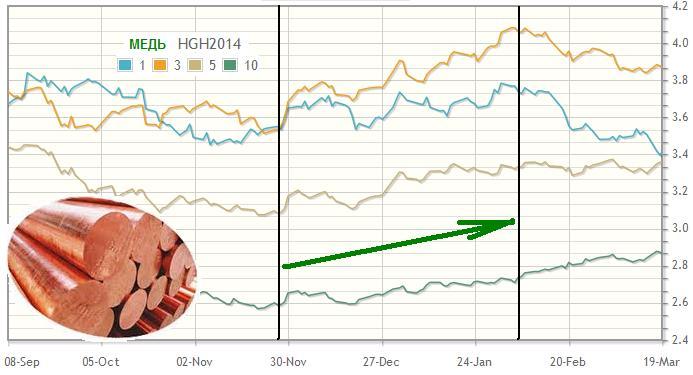
Theblue price line shows last year's seasonal rebound in that time period! Some analysts "globally" attribute this price increase to difficulties in winter delivery of copper raw materials by sea from production sites to northern industrial ports.
However, calendar copper spreads look more promising for exchange trading! Interestingly, they (copper spreads) have an inverse seasonal trend! From the first days of December a long-term seasonal decline begins here! This is clearly visible in the graph of the averaged multi-year seasonal trends of the calendar spread HGH4-HGK4 (March-May):
The seasonal decline in the spread continues until the last decade of February! This Down-trend of calendar copper spreads in the analysed timeframe is believed to be due to higher industrial demand for "long-run" spring and summer futures contracts from large US, Chinese (main global consumer) and European consumers.
Copper spread sales statistics in the analysed timeframe look very good! As an example, let's look at the HGH4-K4 spread's sell-ins over the last thirteen years to February 4:
http://seasonal-traders.com/stats/#stat?HGH2014-HGK2014?2013-11-29?2014-02-04?Sell
The percentage of profitable trades (+11/-1) as well as the average profit/loss ratio (+22 ticks/-9 ticks, 1 tick = $12.5) and the average drawdown look satisfactory enough even to realize an entry on small stock deposits!
Since the seasonality of copper spreads - considered as long-term, there is a reason to break the graph of multi-year seasonal trends into several shorter and more expedient sections for selling! By determining the optimal entry/exit points by building statistical tables on these sections!
Let's see the current situation of the analyzed spread HGH4-K4. Which is shown on the candlestick Daily chart below:
I assume that Friday's sharp spread momentum is due to the FND-expiration of the near-term, Z-Copper contract and the mass transfer of buy positions by exchange players to the March H-Contract.
At the moment, the spread is at its highs, near the upper boundary of the Bollinger channel. And perhaps "preparing" for a seasonal reversal downwards! Waiting for the beginning of the American trading session and the following more active spread movements!
Source: Seasonal trading
Useful information for fans of seasonal spread trading. Below are excerpts from the latest seasonal review I wrote for Pantheon-Finance on commodities:
------------------------------
... The blue price line on the charts of oil and further (below) shows quite a good last year's performance of the analyzed instruments!
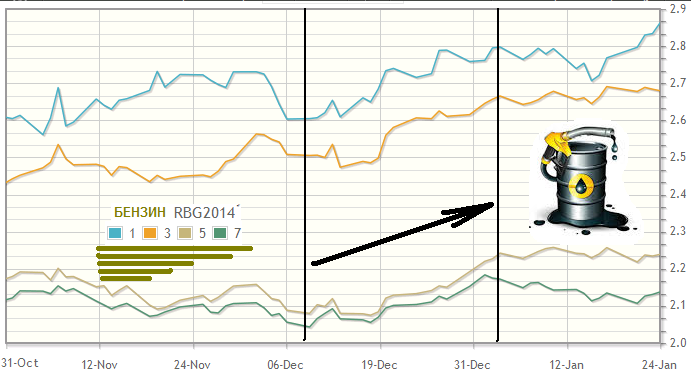

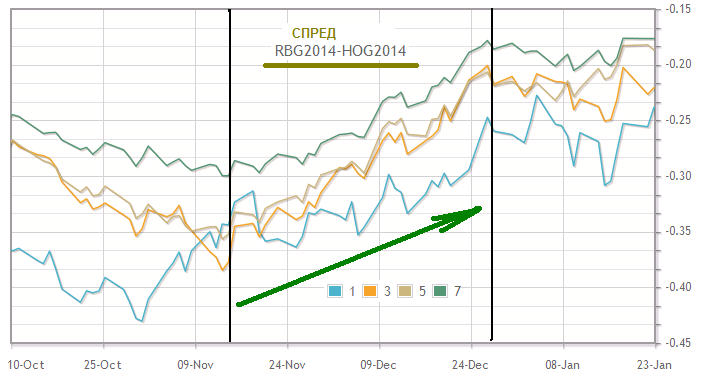
Even more noticeable in the time frame in question is the seasonal increase in XRB gasoline! However, gasoline starts to rise most aggressively around the second half of the December-month:
This is well tracked in the above chart of the average multi-year (3-5-7 year) seasonal trends of the XRB instrument. Here too, it is expected to rise until the first days of January next year, 2014!
Next, let's look at the commodity spreads. And let's start with the calendar gasoline spread (February-March), whose chart of average multiyear seasonal trends (3-5-7 year) looks very interesting and promising:
XRBG4-H4 starts rising steadily from around December 10 and continues until the 25th-28th! Recall that the blue price line here shows a fairly good last year's performance of this spread!
Unfortunately, the statistics for this tool is not yet available on well-known analytical seasonal sites! But using the spread scale, we can roughly estimate an average profit potential of BUY XRBG4 - SELL XRBH4, - approximately +80/+100 ticks (1 tick = $4.20)! However, from my humble experience I will note that calendar gasoline spreads can be very volatile and capricious! Compared to calendar fuel oil spreads, for example!
Speaking of fuel oil!
Speaking of fuel oil, let's take a look at the seasonal outlook for the inter-commodity spread of gasoline and fuel oil! A graph of the average multi-year seasonal trends (3-5-7 years) of the near-term, February G-Contract spread is shown in the figure below:
The average profitable UP potential of the XRB-H0 move through the last days of the year is 700-800 ticks (see scale to the right)! Last year 2012's seasonal payoff (blue price line) from the end of the first decade of December was about +900 ticks! Not bad!
But for small market deposits this spread (in spite of the small value of a tick of $4.20) is extremely dangerous due to its strong volatility! This should be taken into account when deciding to buy a spread!
==========================
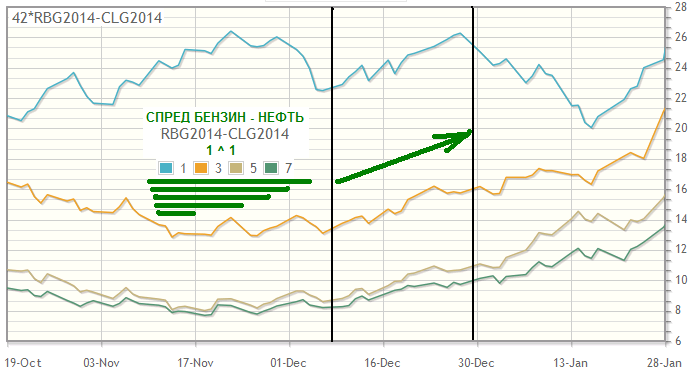
Similarly, XRB gasoline versus CL crude oil (Light Sweet) is rising in the time frame under analysis! Here is a graph of the average multi-year seasonal trends (3-5-7 years) of the February G-trends of this spread XRBG4 - CLG4 = 1:1:
Last year's seasonal rebound (blue price line) also worked out very well here!
Let me remind you that the dimensionality of these instruments (gasoline and oil) is different, and to build statistics and charts on seasonal sites you should set the formula: 42*XRB - CL(see example in the upper left corner of the chart).
For owners of fairly large exchange-traded deposits wishing to enter the inter-commodity spread in a more strategic (long-term) way, the well-known seasonal site MRSI suggests to enter into buying the July spread of gasoline-oil contracts! The statistics for such an entry look attractive! Over the past 15 years, all purchases of the XRBN4 - CLN4 spread from the first days of December to January 29 have been profitable! Below is a seasonal chart and a table of statistics:
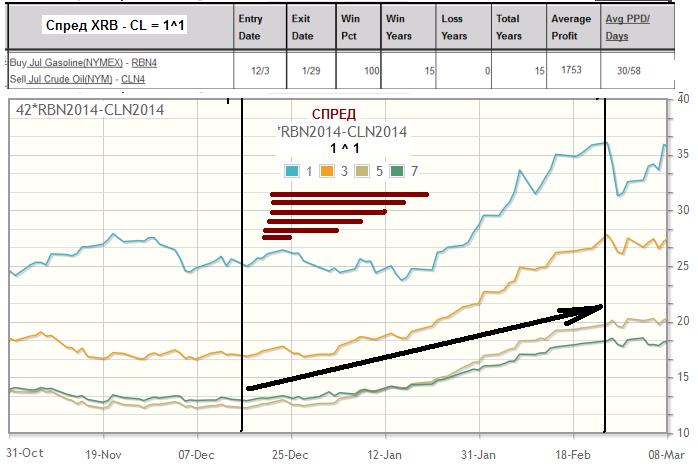
Note that the UP-trend of the spread, judging by the averaged price lines, continues until the last days of February! The blue price line shows last year's good spread working out!
However, we will look at the January and February commodity trends later when the time is right!
Good luck to all!
Source: Seasonal trading
Useful information for fans of seasonal spread trading. Below are excerpts from the latest seasonal review I wrote for Pantheon-Finance on grain instruments:
--------------------
Grain analysts suggest that soybean futures (beans, flour) could come under pressure and start declining soon. Various factors are contributing to this.
"Weather forecasts for the next 6-10 days point to the return of rain in the dry areas of Argentina. Rains are also expected in north-central and north-eastern Brazil. Brazil is the world's main exporter of soybeans and Argentina is the main shipper of feed and oil made from soybeans.
Rainy weather will ease concerns raised by previous forecasts of hot and dry weather and reinforce expectations of a large South American crop. Actually, it is not the weather itself, but the actions of Chinese importers that will lead to a change in the direction of prices on the market. Traders tend to keep an eye on export sales, which have an impact on price movements. However, the more important factor at the moment is soybean shipments, which will be cancelled by China.
In general, the latest export sales reports indicate a slowdown in demand from China. Soybean prices fell last Thursday despite export sales of 1.108 million metric tonnes, 38% higher than the week before. Chinese purchases of 558,000 MT were the lowest level in two months. In September, the four-week average was 704,000 MT. China is now likely to start a seasonal withdrawal from the US soybean market, which it is using as insurance against adverse weather conditions in South America. Thus, China will cancel actual soybean shipments, in the expectation of buying soybeans in Brazil and Argentina at lower prices in March." (c, A.Bortz, spreadinvest.ru)
Clearly, all of the above will result in bearish spreads on soybeans and perhaps soybean meal. Let's see if the fundamentals outlined correspond to the multi-year soybean calendar spreads. Below is a graph of the average multi-year seasonal (3-5-10 year) trends of the ZSH4-N4 bean spread (March/July):
Here we also see that from the second half of December the spread starts to decline! Which is expected until the middle of the first decade of January next year! The blue price line on this chart (and on the chart below) shows last year's rebound!
The seasonal charts of soybean meal calendar spreads look similar. Below are the averaged (3-5-10 year) ZMH4-N4 spread price lines (March/July):
Note that flour spreads are currently "walking" intra-day very volatile (tens of ticks). Therefore, owners of small exchange deposits have reason to take the calendar spreads of "neighboring" contracts(ZMH4-K4,ZMN4-Q4, etc.), working on the sales directly in the market with small targets (from 10-12 ticks) strictly by limit orders!
The current situation for the analyzed spreads is shown in the Daily Charts:
We are waiting for a further decrease in soy spreads!
Review compiled by A. Bortz on Spreadinvest.
Source: Seasonal tradingUseful information for fans of seasonal spread trading. Below are excerpts from the latest seasonal review I wrote for Pantheon-Finance on Agrifarm Group instruments:
-----------------------------
The latest (December) US Department of Agriculture (USDA) livestock report shows the November decline in the number of cattle on US feedlots.
According to analysts surveyed by Dow Jones ahead of the report, the average decline in November was up to 10,000 head! Financial investment in the industry was down 3% compared with the same period last 2012.
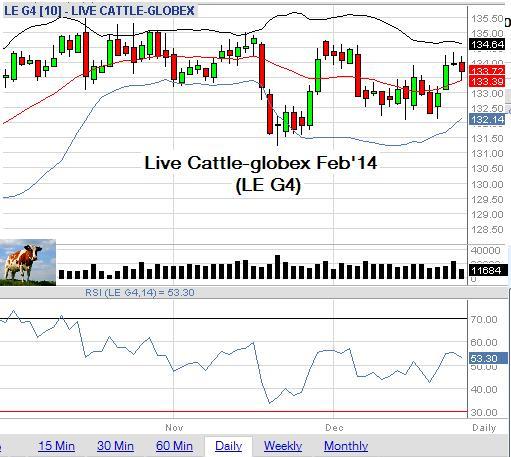
Apparently, these factors can explain the price increase of LE futures contracts from the middle of the first decade of December until today:
At the same time, it is noted that the condition of pastures in most parts of the USA is better than a year ago. Which encourages farmers to increase the number of cows and calves. The price outlook for producers is expected to be quite good! The USDA forecasts an average annual LE (LC) price range of $128 to $137 in 2014. At last year's tool price of $125.80 on average.
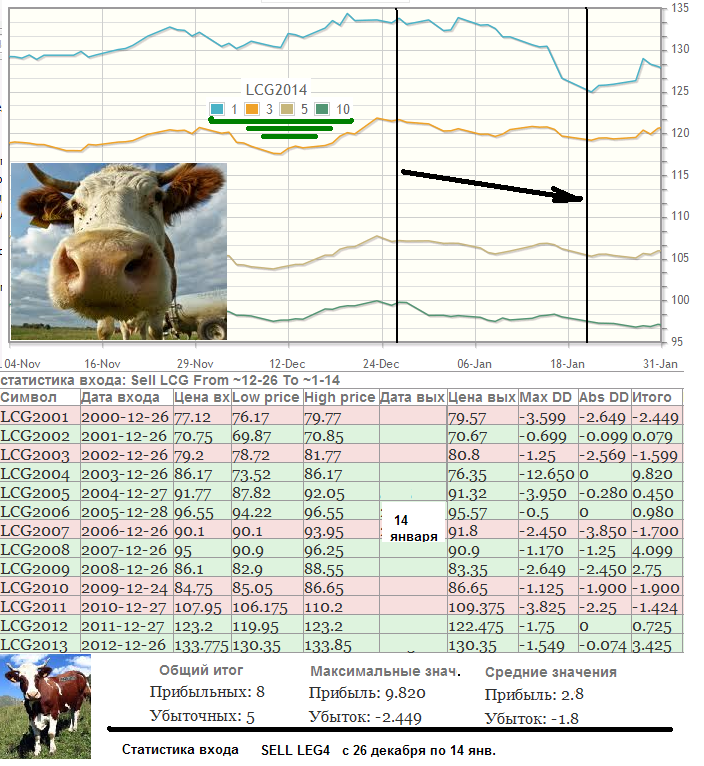
Meanwhile, based on average multi-year seasonal trends (3-5-10 years), a medium-term decline in cattle prices is expected from the last days of the year(The blue price line shows last year's price movement in the time frame under analysis):
Below the seasonal chart are the sales statistics of the February LEG4 futures contract for the last 13 years from December 26 to January 14! The statistics figures (ratio of average profit loss +152 ticks/-72 ticks) confirm the seasonal trend!
Even more pronounced in the interval in question is the Down-seasonality of calendar cattle spreads! For example - below is a graph of multi-year averaged seasonal trends (3-5-10 years) of the LEG4-LEM4 spread, February/June(the blue price line shows a good performance last year):
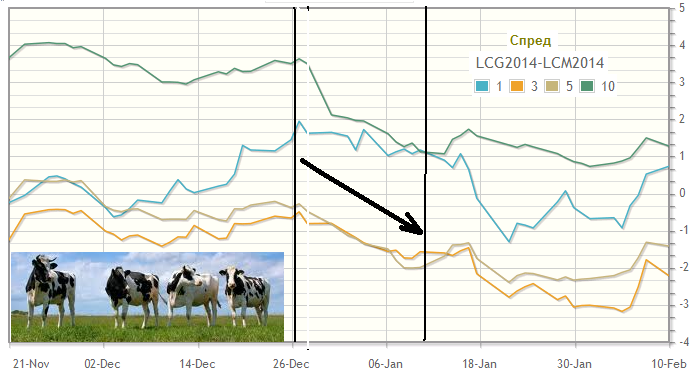
The average profit potential of such an entry(SELL LEG4-M4) is over +50 ticks!
Obviously, for small trading deposits it is the sale of calendar spreads LE until mid-January 2014. - is more reasonable to reduce trading risks for this instrument!
For example, here is a very good statistic for SELL LEG4-J4 (Feb/Apr) entry from Dec 26 to Jan 13:
http://seasonal-traders.com/stats/#stat?lcg2014-lcj2014?2013-12-26?2014-01-13?Sell
(Drawdown max_DD for 2004 in the table is clearly "glitched", because in that year it - drawdowns - was almost none! See the "graph". I see, there is a failure in the quotes file for this year)
I would like to remind you that trading on instruments of this group starts today at 19:05 Moscow time!
Good luck to everyone!
Source: https://panteon-finance.com/analytics/view/instrumenty_gruppy_agrifarm
Useful information for lovers of seasonal spread trading. Below are excerpts from the latest seasonal review I wrote for Pantheon-Finance on grains:
-------------------------------------------------------------
Grains, January 2014. - part 2
Wheat and corn contract prices continue to fall in the US grain markets! While the drop in wheat prices, according to comments by grain experts, is largely due to a fall in export demand for this instrument, the drop in maize prices is attributed by specialists to an expected increase in the maize harvest compared to the (already record) December forecasts!
In addition, analysts estimate that the next USDA "acreage report" tomorrow will show a significant increase in winter wheat acreage compared to last year. Which also puts pressure on wheat markets.
For soybeans, as we noted in our last Grain Outlook (Jan. 8), further price declines are possible as there are prospects for a significant increase in US acreage forthe ZS instrument this spring. As for soybean derivatives ( ZM flour and ZL oil), there is an interesting seasonal pattern! Below is a chart of the multi-year seasonal trends (3-5-10 year) of March soybean inter-commodity spread contracts flour - oil ZMH4 - ZLH4 = 1^1:
http://seasonal-traders.com/stats/#stat?ZMH2014-6*ZLH2014?2014-01-09?2014-01-22?Buy
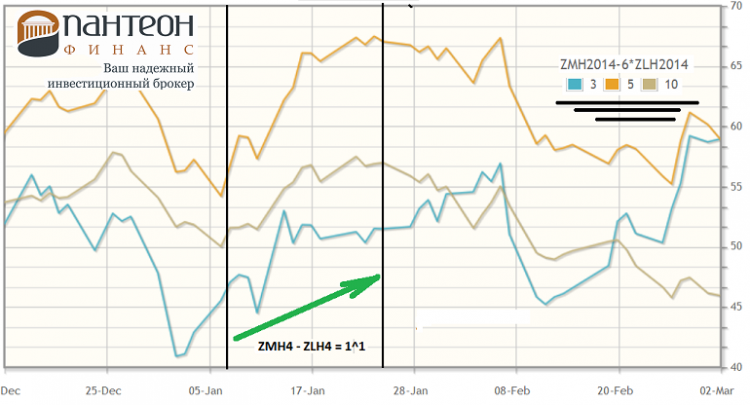
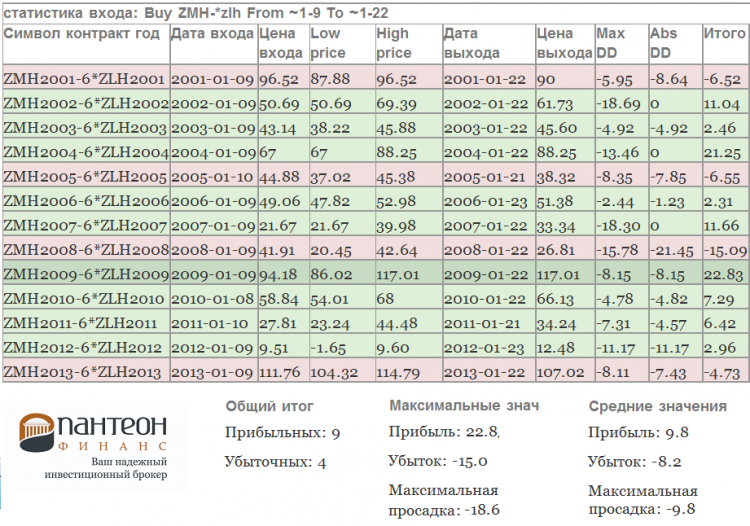
The spread is expected to rise until around the mid-twentieth of this month! For a more concrete assessment of the seasonal movement, let's look at the ZM-ZL buying statistics for the last 13 years from 9 to 22 January!
The statistics figures (percentage of profitable/losing trades and average profit value of +98 ticks on the ZM scale) also confirm the seasonal trend!
Once again, we remind you that the USDA' s monthly USDA report is due out on Friday evening, January 10. Typically, the release of this USDA report is accompanied by strong moves in grains and cotton - all the way through the trading session!
Source: https://panteon-finance.com/analytics/view/zernovye_kulqtury_janvarq_-_chastq_2
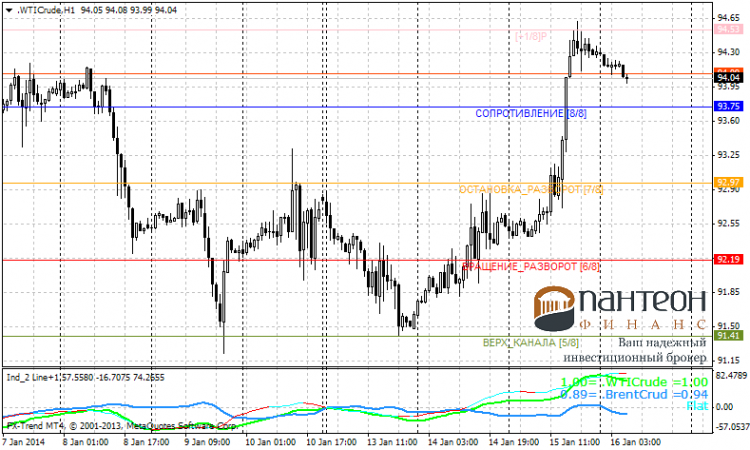
Commodities (based on EIA report)
---------------------------
 [img]http://img-fotki.yandex.ru/get/9058/16794745.a/0_cb3c6_4f29f963_XL.png[/img]

Last night the US Department of Energy ( EIA) released another report on the country's commodity inventories for the past week.
According to statistics (contrary to expectations of "commodity analysts") oil reserves decreased sharply - by 7.7 mln barrels. In fact, according to the earlier estimates it was -1.3mb.
As a result, oil prices went up sharply after the report was released!
Both WTI and Brent also benefited from a 1.072mmbbl fall in US oil imports.
Unexpectedly, gasoline inventories rose sharply. Analysts had expected an increase of 2.5mb, but the actual increase was 6.2mb!
Distillate stocks (including heating oil) fell by 1.023m barrels to 123.95m barrels! Which, following the oil price, also caused an increase in the price of HO instruments (heating oil).
At the moment, we are seeing a Down-correction beginning after yesterday's strong rise. Today at 19:30 Moscow time the US NG natural gas inventory data for the past week will be released.
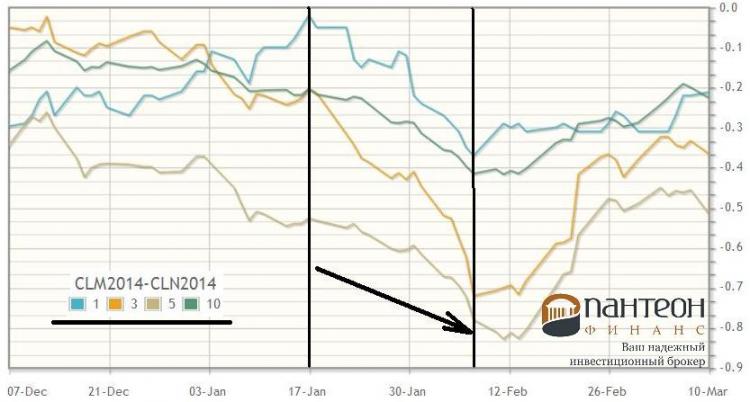
To conclude the review, we suggest to pay attention to an interesting January seasonal pattern in the US CL (Light Sweet) oil spread. Since the second half of the month, there has been a medium-term decline in the calendar spread of this CLM4 - CLN4 oil (June-July). Below is a graph of multi-year average seasonal (3-5-10TI years) spread trends:
The spread is expected to decline until the end of the first decade of February! CLM4-N4 sales statistics for the last thirteen years confirm the indicated Down-seasonality!
The ratio of the average profit/loss(+26 ticks/-11 ticks) and the percentage of profitable entries(+9/-4) make selling the spread in the specified time interval - attractive enough even for very small stock deposits!
Good luck to all!
Source: https://panteon-finance.com/analytics/view/syrqevye_instrumenty_po_otchetu_eia