You are missing trading opportunities:
- Free trading apps
- Over 8,000 signals for copying
- Economic news for exploring financial markets
Registration
Log in
You agree to website policy and terms of use
If you do not have an account, please register
How about "time between ticks depending on the volume of the bar already achieved"? You would clarify the essence of the question right away.
Counter to the number of ticks, depending on the volume of the previous bar...
;)
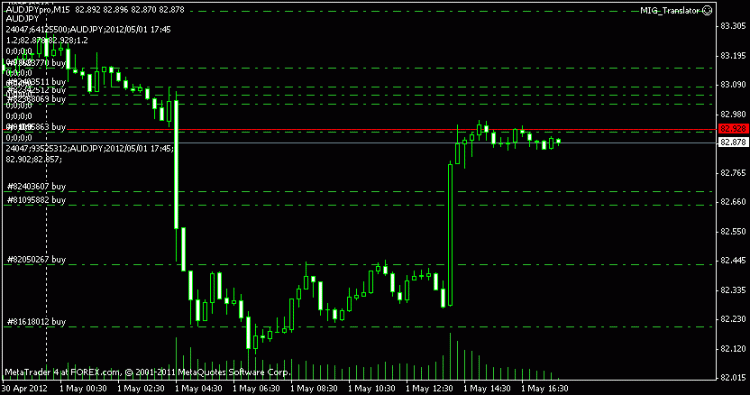
As we can see, after a strong spurt, the tick activity "dissipates" gradually.
Well, it's just approximation counting on the fact, that the price went from low to low, then to high and returned to low... But the whole point is lost, if you approximate the movement inside the bar by three segments...
Well, everything is not so bad: on М1 - М15 the formula allows to estimate the tick volume regardless of what a DT gives, on higher TF it is better to estimate how many times the bar has changed its colour during its formation - quite clearly there is a pattern in the number of bar colour changes, I have an indicator somewhere, need to look for it
If the question is about the density of ticks - tick/sec (tick/min), then only by experiment, I saw myself how tick volumes for 2010 were "drawn on history" - I was just fond of ticks
By the way, the picture reminds me of the catastrophe theory, when you reach 200-300 pips there is a strong pullback
Countered by the number of ticks, depending on the volume of the previous bar...
;)
As we can see, the tick activity "dissipates" gradually after a strong spurt.
Unfortunately, there isn't one((.
And you can.
take a look?Everything, predictably, rose only slightly above the abscissa axis.
Everything, predictably, rose only slightly above the abscissa axis.
Weird, thought it would be at most around 300pp, something like a long shadow candlestick.
Strange, I thought it would max out at around 300pp, something like long shadow candlesticks.
I looked at the charts, such volumes are very rare, only 4 times this year there were more than 150 ticks. And they appear immediately after abnormally long candles of 400pp. Maybe the central banks are starting to interfere?