NZD/USD Technical Analysis: Selloff Extends for Fifth Day(adapted from dailyfx article)
NZD/USD Technical Strategy:Short at 0.7783
Support: 0.7420, 0.7275, 0.7130
Resistance:0.7529, 0.7599, 0.7680
The New Zealand Dollar fell against its US namesake as expected,
with prices now hitting levels unseen since May 2012. A daily close
below the 38.2% Fibonacci expansion at 0.7420 exposes the 38.2% level at
0.7275. Alternatively, a move above channel floor
support-turned-resistance at 0.7529 opens the door for a challenge of
the 23.6% Fib at 0.7599.
If D1 price will break 0.7678 support level so we may see the bearish market condition
If D1 price will break 0.7889 resistance level so the bullish trend will be continuing If not so we can see the total ranging within the primary bullish and the primary bearish
Recommendation for long: watch D1 price to break 0.7889 resistance for possible buy trade
Recommendation to go short: watch D1 price to break 0.7678 support level for possible sell trade
Trading Summary: ranging
D1 price broke 0.7678 support level from above to below and this is 0.7460 for now:
So, if you use my suggestion to place sell stop order at 0.7678 so you should have about 200 pips in profit for now.
read technical analysis and make a right decision!
Allow the use of cookies to log in to the MQL5.com website.
Please enable the necessary setting in your browser, otherwise you will not be able to log in.
You are signed in. Two-factor authentication has been disabled. Set it up again and scan a new QR code, or continue with two-factor authentication disabled.
Forum on trading, automated trading systems and testing trading strategies
Press review
newdigital, 2015.01.23 12:13
NZD/USD Technical Analysis: Selloff Extends for Fifth Day (adapted from dailyfx article)
The New Zealand Dollar fell against its US namesake as expected, with prices now hitting levels unseen since May 2012. A daily close below the 38.2% Fibonacci expansion at 0.7420 exposes the 38.2% level at 0.7275. Alternatively, a move above channel floor support-turned-resistance at 0.7529 opens the door for a challenge of the 23.6% Fib at 0.7599.
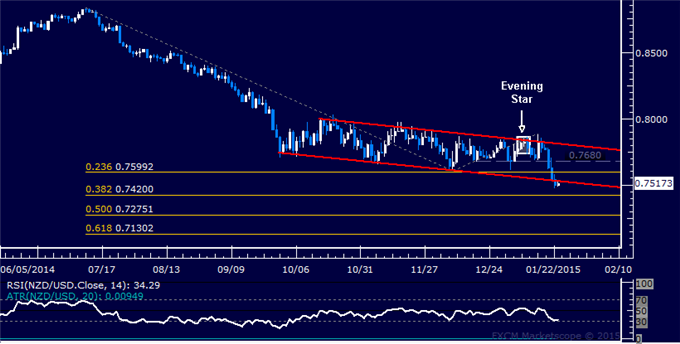
If D1 price will break 0.7678 support level so we may see the bearish market condition
If D1 price will break 0.7889 resistance level so the bullish trend will be continuing
If not so we can see the total ranging within the primary bullish and the primary bearish
D1 price broke 0.7678 support level from above to below and this is 0.7460 for now:
So, if you use my suggestion to place sell stop order at 0.7678 so you should have about 200 pips in profit for now.
read technical analysis and make a right decision!