Impulse - page 7
You are missing trading opportunities:
- Free trading apps
- Over 8,000 signals for copying
- Economic news for exploring financial markets
Registration
Log in
You agree to website policy and terms of use
If you do not have an account, please register
I don't understand... what's on the parabola?
add a bit of fast quadratic growth (get a parabola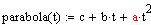 with superimposed oscillations)
What would it all look like if you replaced the function with a parabola?
add a little quick quadratic growth
Interesting correlations. But the change in forex price can be roughly described by which equation of the ones you cited?
I clarified there, meaning a parabola
I clarified there, meaning the parabola
I see. simpler: s(t)=parabola, what do you get?
A parabola is a line of second order. Its acceleration is a constant, so the derivative of the acceleration (jerk) is zero :
A parabola is a line of second order. Its acceleration is a constant, so the derivative of the acceleration (jerk) is zero :
Interesting correlations. But the change in forex price can be approximated by which of the equations you cited?
If we do not impose any proximity requirements (like MOC, etc.), this formulation is incorrect.
The same interval of price movement can be described by a straight line, or by a sinusoid, or by a complex set of different components. Everything will depend on the purposes of such description, and these purposes dictate an acceptable degree of approximation closeness to the original series.
ah, right. i.e. is it possible that at jerk=0 there is a start/end impulse?