Machine learning in trading: theory, models, practice and algo-trading - page 3091
You are missing trading opportunities:
- Free trading apps
- Over 8,000 signals for copying
- Economic news for exploring financial markets
Registration
Log in
You agree to website policy and terms of use
If you do not have an account, please register
On page 8 so far. And this is still an introduction)))
It looks like it will be a comparison by Sharpe (but they write that you can use any other indicator) on cross validation.
As I understand it, 4 parameters should be optimised there
However, it should be noted that these values may depend on the selected performance metric and threshold value
Need multi-criteria Pareto front-to-back multi-criteria optimisation
as I understand it there are 4 parameters to optimise
However, it should be noted that these values may depend on the performance metric chosen and the threshold value
Too short to understand what these parameters are. here is more from the article page 13 (if the package fully reproduces the methods in the article, but maybe something else added/subtracted)
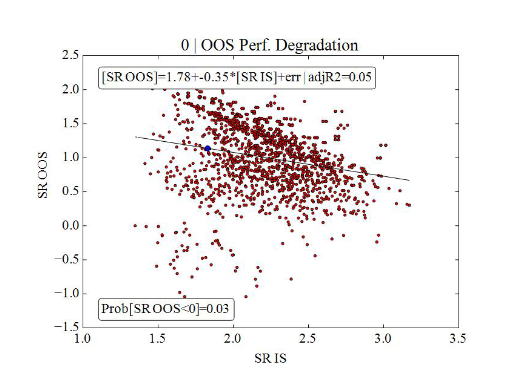
Overfit statistics
The framework introduced in Section 2 allows us to characterise the relia-
bility ofa strategy's backtest in terms of four complementary analyses:
1. Probability of Backtest Overfitting (PBO): The probability that the
model configuration selected as optimal IS will underperform the me-
dian of the N model configurations OOS.
2. Performance degradation: This determines to what extent greater per-
formance IS leads to lower performance OOS, an occurrence associated
with the memory effects discussed in Bailey et al. [1].
3. Probability of loss: The probability that the model selected as optimal
IS will deliver a loss OOS.
4. Stochastic dominance: This analysis determines whether the proce-
dureused to select a strategy IS is preferable to randomly choosing
one model configuration among the N alternatives
Each item is discussed in more detail below.
It's too short to understand what these parameters are. here's more from the article page 13 (if the package fully reproduces the methods in the article, but maybe something else was added/subtracted).
the package is just awful, never seen such a partak in years
code is terrible
the documentation is practically useless
I don't understand how it got into CRAN.
I still can't understand, is there one trading system is investigated divided into batches or is it several TS (in this library)?
I still can not understand, there one trading system is studied divided into batches or it is several TS (in this library).
Selection of the best model among a set of models obtained with different parameters/hyperparameters. The input is a matrix, where each column is a forecast of one of the models.
Or maybe not. I haven't figured it out yet eitherSelection of the best model among the set of models obtained at different parameters/hyperparameters. The input is a matrix where each column is a prediction of one of the models.
I've already figured this out.
I don't understand how to work with the result
I give one column (one TS)
result
I feed 5 columns (five TCs)
I also get one row.
There should be 5 rows, or if it is the result of the best TS, there should be a mndex of the best one...
I would kill this author
Selection of the best model among the set of models obtained at different parameters/hyperparameters. The input is a matrix where each column is a prediction of one of the models.
Or maybe not. I haven't figured that out yet eitherIt can be interpreted as taking TS profit returns from different market sections ( parameters/hyperparameters ) ????
different market sections == parameters/hyperparameters?
It can be interpreted as taking returns of TC profit from different parts of the market ( parameters/hyperparameters ) ????
Exactly profit retournals.
different parts of the market == parameters/hyperparameters?
As I understood exactly settings: different periods of MA, SL, etc.
I also get one line
There should be 5 lines, or if it's the best TC, there should be a mndex of the best...
As a result, you get the overall evaluation of the model (and probably of the predictor and target data)
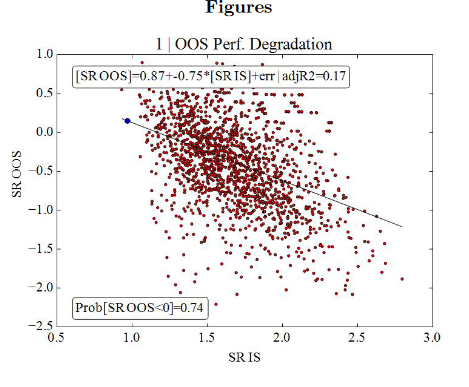
A bad model gives such outcomes (only 17% of OOS outcomes above 0).
Good model - 95% of OOS outcomes above 0
It is the returnees who have arrived.
You know, gains and losses, right?
So we take the retournals of the states when the position is open.
As I understand it, it is the settings: different periods of MA, SL, etc.
Instead of different settings of the TS, I'll just take trading on different areas, I think it can be equated.
you know, profit and loss, right?
So we take retournals from those states when the position is open.
yeah.
instead of different TS settings I'll just take trading on different sections, I think it can be equated.
I'm not sure.
And in general. read the article to understand what you are doing, there are limitations. For example, it is necessary to give obviously successful settings, not -1000000 to +1000000. If you give everything in a row, the average OOS will be at the bottom and there is no point in comparing with it. A very narrow range of 0,95...,0,98 is also bad from the DR side - the results will be very close.