Trouble getting histogram to work right
Add 1 buffer, Mask[] (DRAW_HISTOGRAM, STYLE_SOLID, width 1, color Black) and add the following code in the first roop.
if (H1[i] < H2[i])
  Mask[i] = H1[i];
else if (H1[i] >= H2[i])
  Mask[i] = H2[i];
Add 1 buffer, Mask[] (DRAW_HISTOGRAM, STYLE_SOLID, width 1, color Black) and add the following code in the first roop.
Thanks. That gets us somewhere, but it also masks the vertical graph bars on the chart too (see first attachment).
Why would this indicator require masking whereas other ones seem to do what I want automatically? Here's an MA crossover indicator that doesn't seem to require any additional calculations to fill in between the lines (shown in 2nd attachment)...
//+------------------------------------------------------------------+
//|                                                  MMA COLORED.mq4 |
//|                      Copyright © 2010, MetaQuotes Software Corp. |
//|                                        http://www.metaquotes.net |
//+------------------------------------------------------------------+

#property copyright "pipsforever"
#property link      "http://www.trader-forex.fr/forum/programmation/30240-changer-la-couleur-dune-mm.html#post87444"

#property indicator_chart_window
#property indicator_buffers 4

extern int Fast = 8;
extern int Slow = 24;
extern color Up = Yellow;
extern color Down=Red;
extern color Ma_1 = Yellow;
extern color Ma_2 = Red;
double H1[];
double H2[];
double M1[];
double M2[];


//+------------------------------------------------------------------+
//| Custom indicator initialization function                         |
//+------------------------------------------------------------------+
int init()
  {
//---- indicators
SetIndexBuffer(0,H1);
SetIndexStyle(0,DRAW_HISTOGRAM,0,2,Up);

SetIndexBuffer(1,H2);
SetIndexStyle(1, DRAW_HISTOGRAM,0,2,Down);

SetIndexBuffer(2,M1);
SetIndexStyle(2,DRAW_LINE,0,2,Ma_1);

SetIndexBuffer(3,M2);
SetIndexStyle(3,DRAW_LINE,0,2,Ma_2);
//----
   return(0);
  }
//+------------------------------------------------------------------+
//| Custom indicator deinitialization function                       |
//+------------------------------------------------------------------+
int deinit()
  {
//----

//----
   return(0);
  }
//+------------------------------------------------------------------+
//| Custom indicator iteration function                              |
//+------------------------------------------------------------------+
int start()
  {
   int    counted_bars=IndicatorCounted();
//----
   for (int i =0; i<Bars-Slow; i++)

   {
     H1[i] = iMA(Symbol(),0,Fast,0,MODE_SMA,PRICE_CLOSE,i);
     H2[i] = iMA(Symbol(),0,Slow,0,MODE_SMA,PRICE_CLOSE,i);

     M1[i] = iMA(Symbol(),0,Fast,0,MODE_SMA,PRICE_CLOSE,i);
     M2[i] = iMA(Symbol(),0,Slow,0,MODE_SMA,PRICE_CLOSE,i);

   }
//----
   return(0);
  }
//+------------------------------------------------------------------+
The difference lies here:
#property indicator_separate_window#property indicator_chart_window
Depending on whether it is displayed on the main chart or on the subwindow, the Histogram style behaves differently. On the subwindow it displays the histogram growing from the zero-line.
Exactly.
In a separate window, histograms are drawn from the buffer value to zero. They are drawn from the first to the last. If you want one to be the background, it must be the first buffer.
See also
How to Draw Cnadle chart in indicator_separate_window ? (XDXD) - MQL4 programming forum (2016)
That depends on what YOUR definition of "work the way I want it to".
Also, you will have to totally rethink your indicator for MQL5 as there are differences, as you are using the old style code of MQL4 which is totally incompatible with MQL5. Had you been using the more modern MQL4+ style, it would have been easier for you to port it, but not as it is now. For one you will have to use the OnInit and OnCalculate event handlers, instead of the "init" and "start" handlers.
"Work the way I want it to" as in filling in between the two RSI lines like I spoke about in my original comment.
I just modified this indicator from one of the stock MQL4 ones, and I'm just figuring out how to move forward with it – whether to try it myself with my programmer friend or hire a developer. This is helpful for me to get clear on that.
Thanks!
- Free trading apps
- Over 8,000 signals for copying
- Economic news for exploring financial markets
You agree to website policy and terms of use
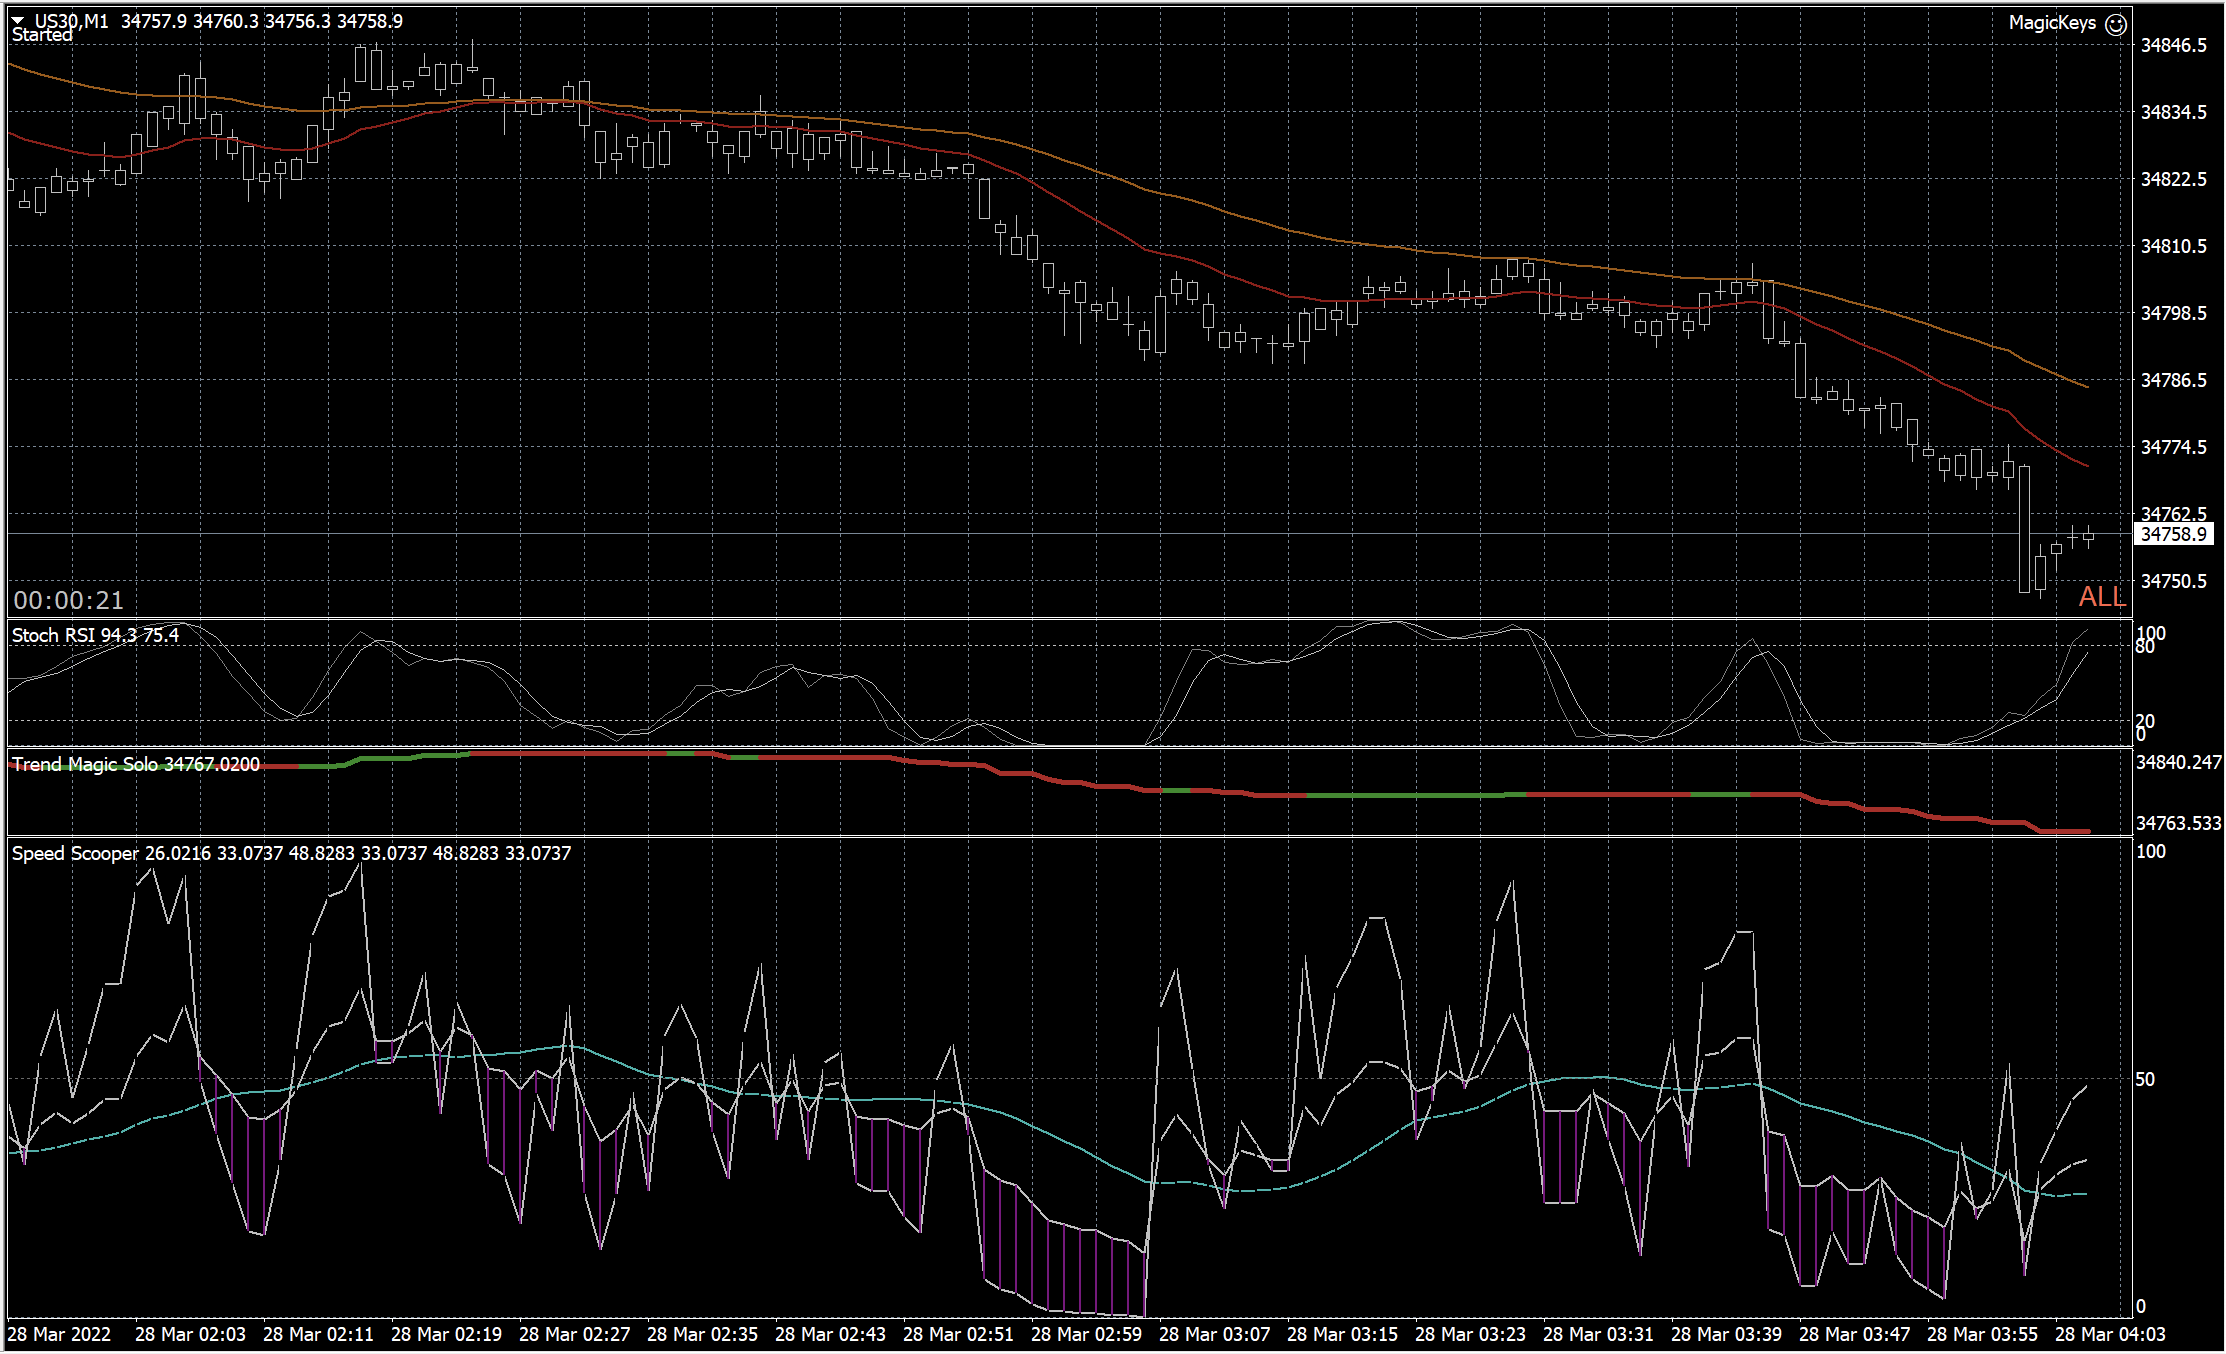
Hi gang, I'm trying to build an indicator for the first time in MT4 and myself and my programmer friend are stumped why the histogram is not working the way we want in this indicator.
We've been examining other indicators that use the histogram to create a cloud between two dynamic variables, and can't tell what we're missing.
This indicator has two RSIs of different speeds, with a moving average overlaid.
Currently both RSIs are plotting their histograms between the 0 level and the current RSI level. I want the histogram to fill in the space between the two RSIs.
Any thoughts on what we're missing here?
Thanks in advance!
I've attached a link to a screenshot below.