Cant plot full contents of buffer.
You should always think about economical recalculation of values! DO NOT count the ENTIRE history at every tick!
Algorithm example:
//--- main loop
   int limit=prev_calculated-1;
   if(prev_calculated==0)
      limit=0;
   for(int i=limit; i<rates_total; i++)
     {
      CalculateVolumentum(i,tick_volume,open,close);
     }
You should always think about economical recalculation of values! DO NOT count the ENTIRE history at every tick!
Algorithm example:
Thank you so much for the help.
I think i need some help understanding exactly what prev_calculated is, like what is the initial value
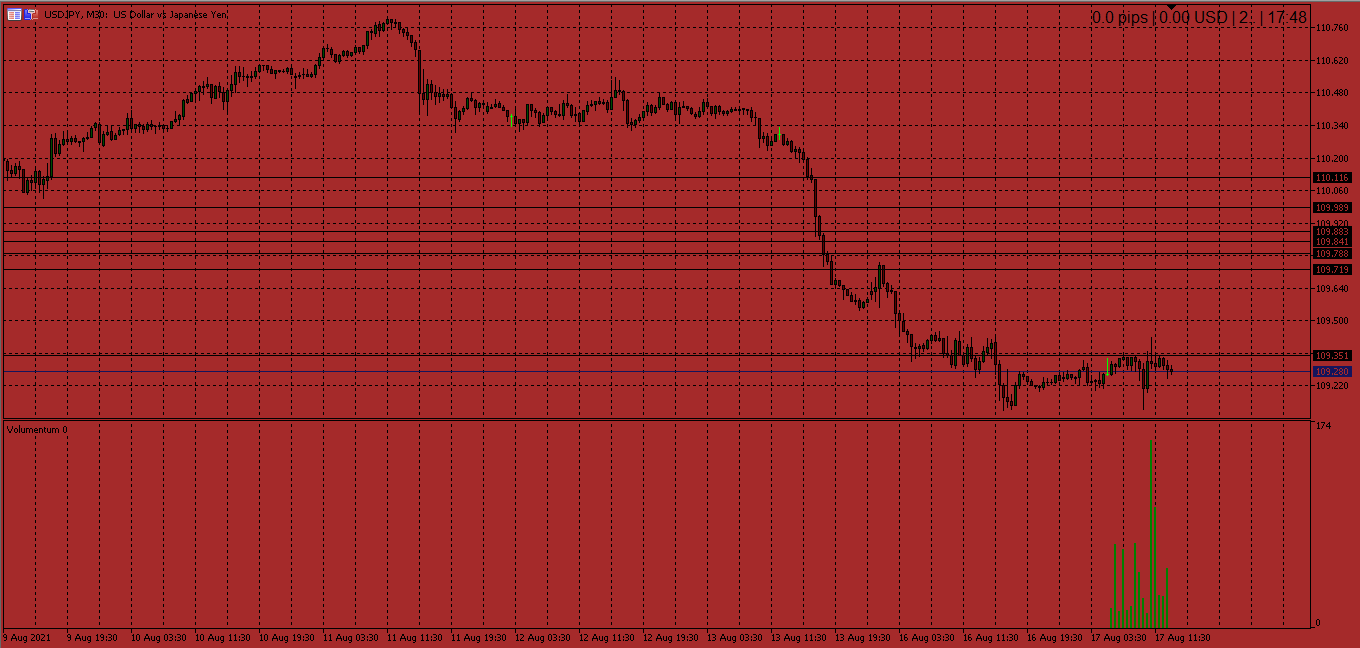
And yeah I implemented the way you suggested though i didnt really see the logic difference and again same problem, can only see output for like the last few bars, GJ is showing the most bars but only 125 also.
Ive attached a picture to show how it looks exactly. The indicator is in its own indicator window.
Thank you so much for the help.
I think i need some help understanding exactly what prev_calculated is, like what is the initial value
And yeah I implemented the way you suggested though i didnt really see the logic difference and again same problem, can only see output for like the last few bars, GJ is showing the most bars but only 125 also.
Ive attached a picture to show how it looks exactly. The indicator is in its own indicator window.
See How to do your lookbacks correctly #9 … #14 & #19.
- Free trading apps
- Over 8,000 signals for copying
- Economic news for exploring financial markets
You agree to website policy and terms of use
So am trying to make an indicator that gives the ratio between each candles volume and its body size(close-open).
But i just cant seem to be able to print a plot for all available bars in history. It always stops plotting at index 35(the 36thbar).As new candles come in it works fine it plots a new value as soon the
new candle closes.
I am kindly requesting for assistance from anyone please.