Discussion of article "Cluster Analysis (Part I): Mastering the Slope of Indicator Lines"
Here it compiles without any problem.
Please show why and what the compiler complains.
Thank you Carl. The problem was on my end, I had updated my MT5 and now all is fine.
Hi Carl,
I am very interested in your work. I have considered an approach to analyzing the indicator slopes but this seems so much better, so I will be following your articles closely.
It would help immensely if you could add column headings and row numbers to your printout. If you are willing, I will do it and forward the results to you.
I'm looking forward to your next article.
?
Haven't you seen the header:
GBPUSD PERIOD_D1 HalfTrd 2 ID Cluster Num. (tot %) µ (mult*µ) σ (Range %) min - max
followed by the lines with the numbers:
GBPUSD PERIOD_D1 HalfTrd 2 100100 learn 100% all[9] 7266 (100.0%) 217.6 (1.00*µ) 1800.0 (1.21%) 0.0 - 148850.0
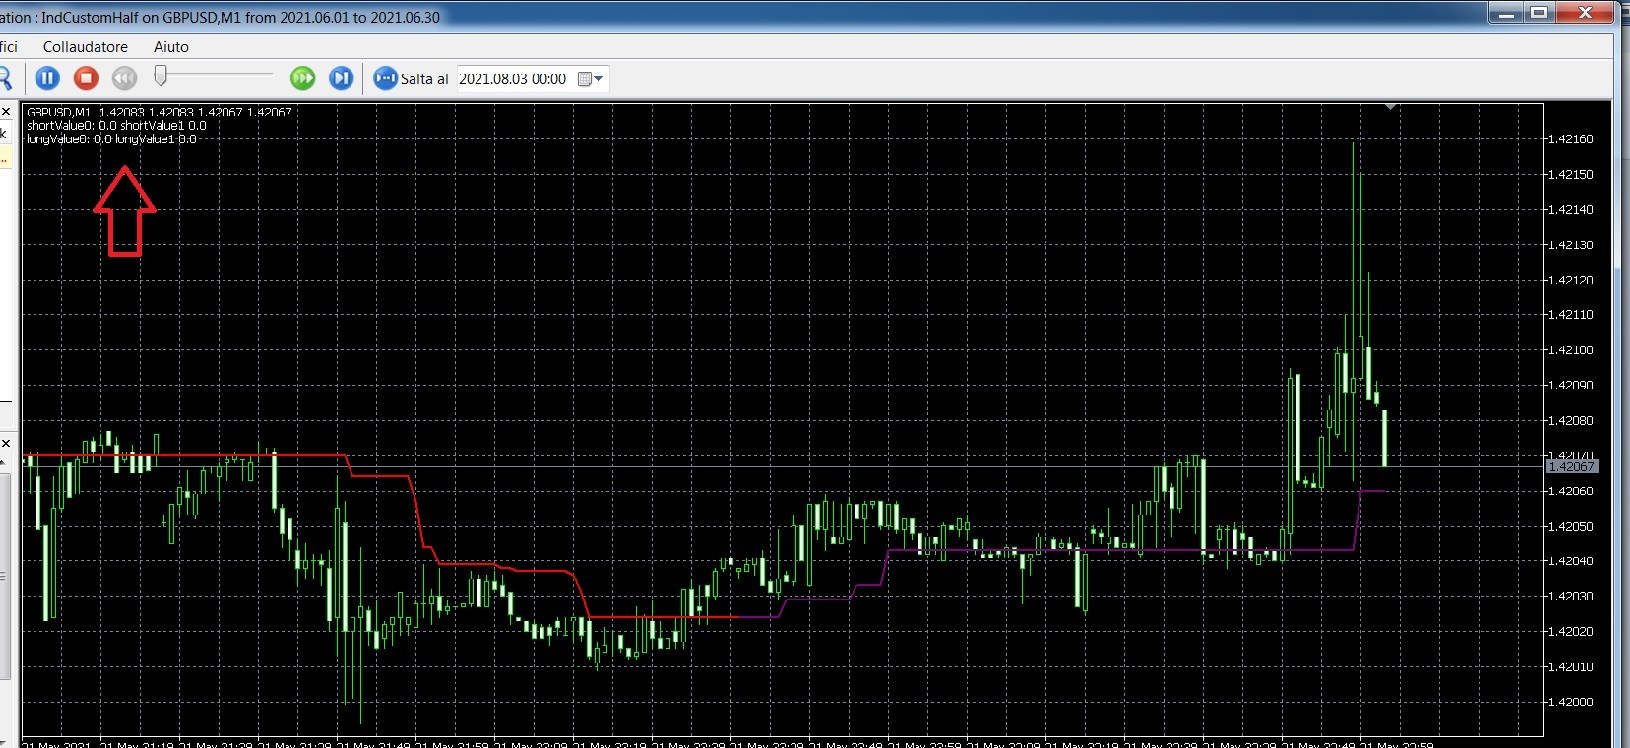
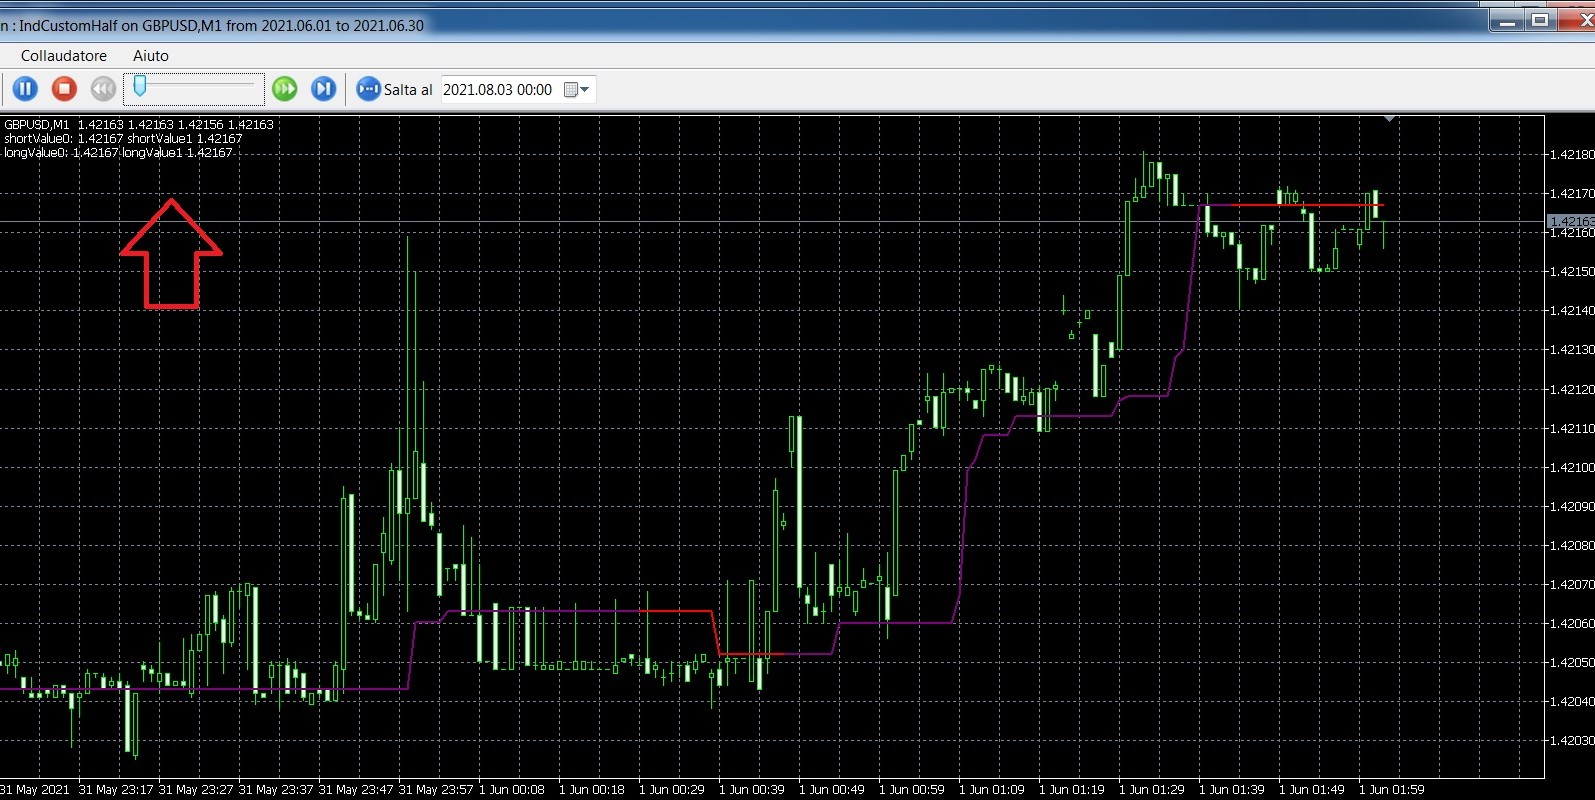
input uint Amplitude=10;
uint CorrelationDefination, CorrelationDefination2;
int OnInit()
  {
//---
    CorrelationDefination=iCustom(NULL,Period(),"half-trend-analysingTrend",10,false,false,false,false,false,false,false,1,PRICE_CLOSE);
    CorrelationDefination2=iCustom(NULL,Period(),"half-trend-analysingTrend",10,false,false,false,false,false,false,false,1,PRICE_CLOSE);
//-
//---
   return(INIT_SUCCEEDED);
  }
//+------------------------------------------------------------------+
//| Expert deinitialization function                                 |
//+------------------------------------------------------------------+
void OnDeinit(const int reason)
  {
//---

  }
//+------------------------------------------------------------------+
//| Expert tick function                                             |
//+------------------------------------------------------------------+
void OnTick()
  {
//---
   double short_period[];
   double long_period[];
   ArraySetAsSeries(short_period,true);
   ArraySetAsSeries(long_period,true);
   CopyBuffer(CorrelationDefination,1,0,3,short_period);
   CopyBuffer(CorrelationDefination2,1,0,3,long_period);
   double shortValue0=short_period[0];
   double longValue0=long_period[0];
   double shortValue1=short_period[1];
   double longValue1=long_period[1];
   Comment("shortValue0: ",shortValue0," shortValue1 ",shortValue1,"\n",
           "longValue0: ",longValue0," longValue1 ",longValue1);
  }
Hi Carl, i can't recall it as castom indicator, i attach the code. Only work with the DOWN baffer (shortValue)
Hi Carl, i can't recall it as castom indicator, i attach the code. Only work with the DOWN baffer (shortValue)
What is the problem? You must have changed something (due to PRICE_CLOSE whic is ok btw) but this way I can't help you.
Can you start it on the chart?
it is a part of EA that writes indicator values. in visual mode it reads me only the red (short) values, but does not write the long values, see attached images
- Free trading apps
- Over 8,000 signals for copying
- Economic news for exploring financial markets
You agree to website policy and terms of use
New article Cluster Analysis (Part I): Mastering the Slope of Indicator Lines has been published:
Cluster analysis is one of the most important elements of artificial intelligence. In this article I try to apply cluster analysis of the slope of an indicator to get thresholds to determine whether a market is flat or following a trend.
As an indicator I use "HalfTrend" from MQ, which is attached below. It has longer passages in which it runs horizontally:
My question to this indicator now was whether there is a clear separation, i.e. threshold, which can be interpreted as a sign for flat and a threshold signaling a trend, be it up or down. Of course, everyone immediately sees that if this indicator is exactly horizontal, the market is flat. But up to which height of the slope are the changes in the market so small that the market is still to be considered flat and from which height one must assume a trend. Imagine the EA sees only one number, in which the whole chart picture is concentrated and not, as we see in the picture above, the bigger picture. This will be solved by the cluster analysis. But before we turn to the cluster analysis, we first consider the changes that were made in the Indicator.
Author: Carl Schreiber