Why I can't see parapolic SAR on metatrader-4 platform?
I did include Parabolic SAR on the chart.
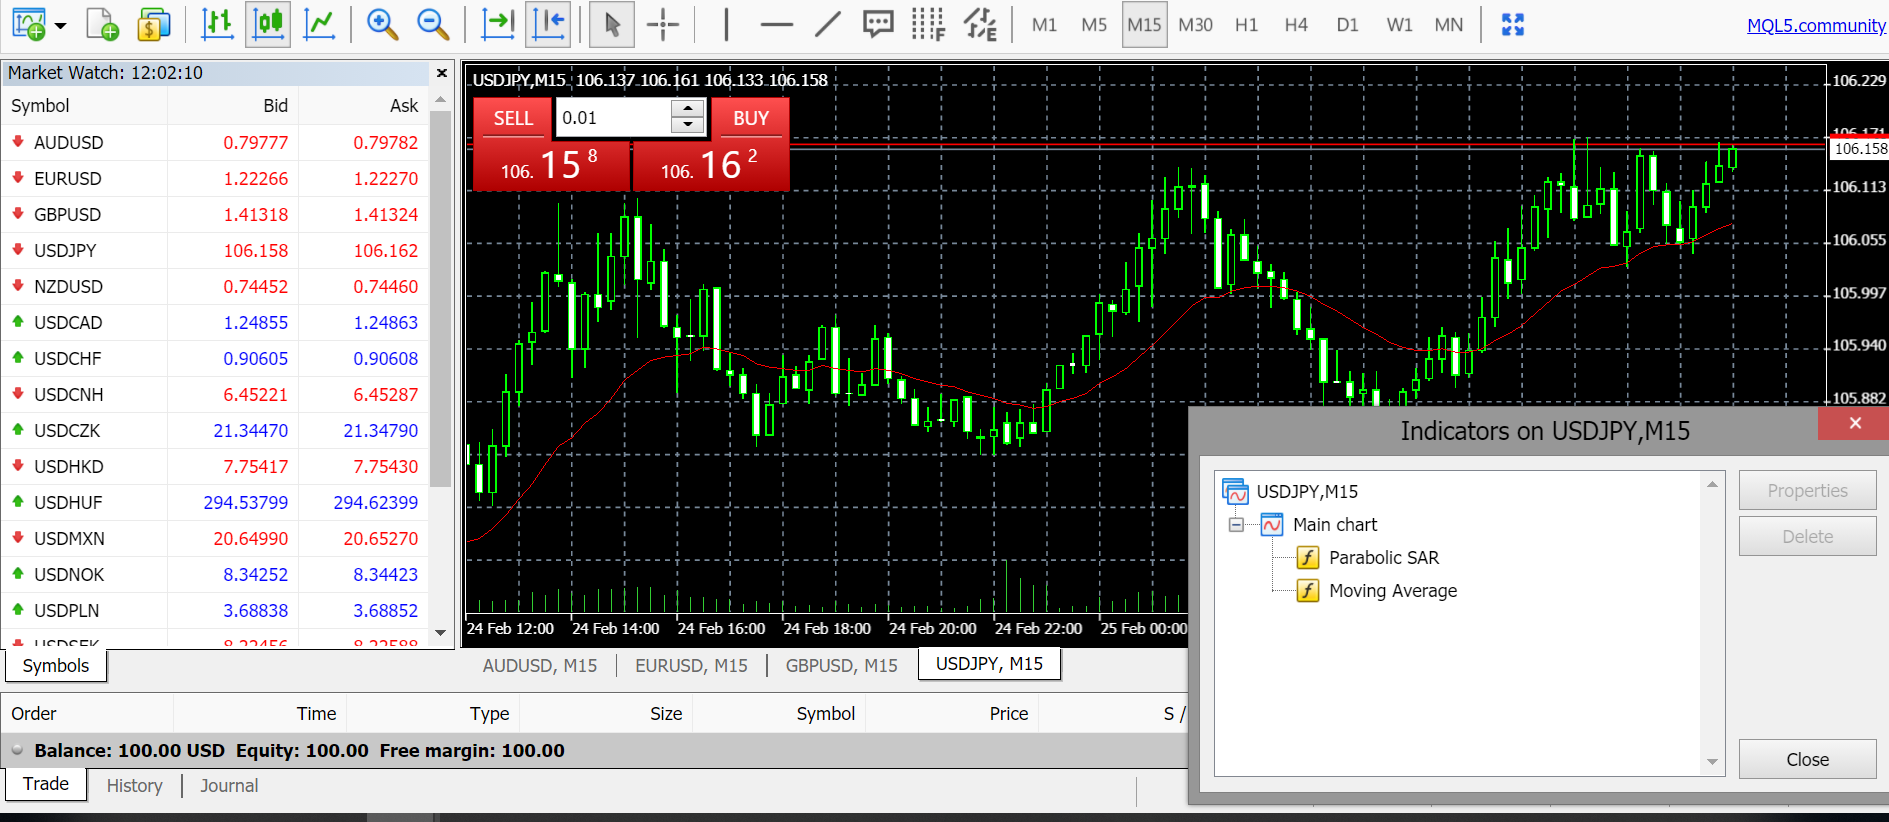
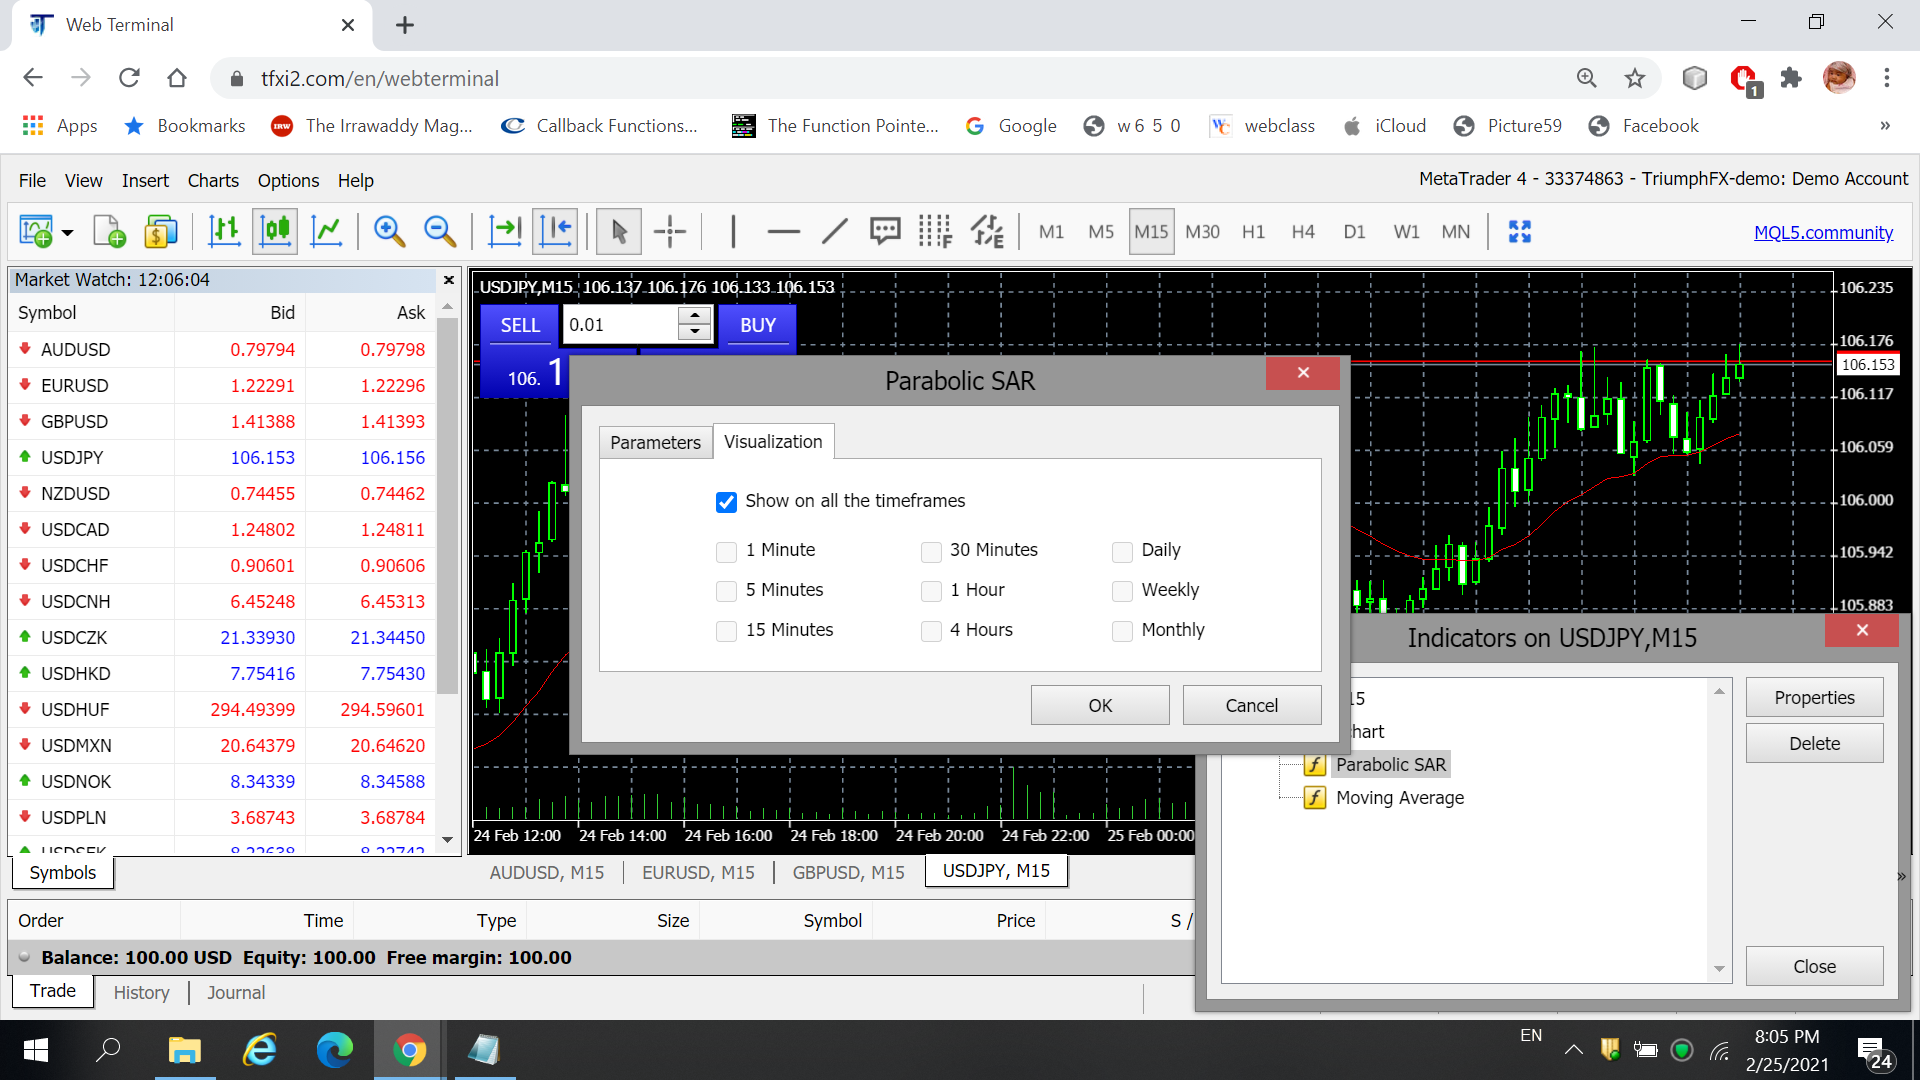
Indicator list shows that there is PSAR on the chart. But I can't see it. PSAR properties box doesn't have color change option. How can I see PSAR pattern on the chart?
The chart is shown in the attached picture .
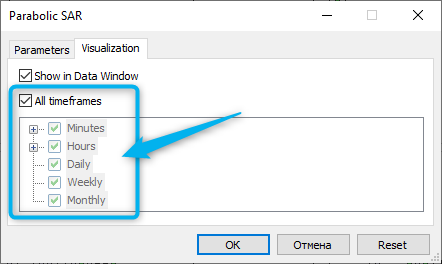
Check visibility on timeframes:
I did include Parabolic SAR on the chart.
Indicator list shows that there is PSAR on the chart. But I can't see it. PSAR properties box doesn't have color change option. How can I see PSAR pattern on the chart?
The chart is shown in the attached picture.
The dots are bright green usually , does anything appear if you right click on the chart->properties->yellow on black ?
The dots are bright green usually , does anything appear if you right click on the chart->properties->yellow on black ?
I have change background. But still not shown. You can see in the attached file. Indicator list shows that Parabolic SAR is in indicator list.
But not shown.
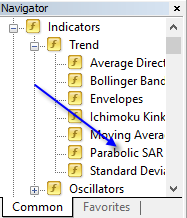
Parabolic SAR is here in Metatrader:
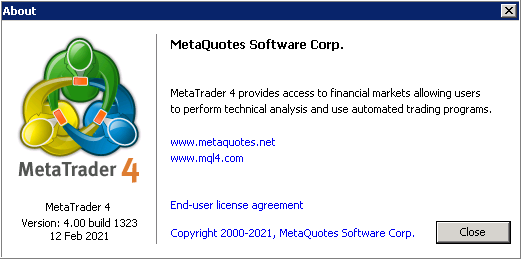
and check your build (and update Metatrader if necessary):
Check visibility on timeframes:
- Free trading apps
- Over 8,000 signals for copying
- Economic news for exploring financial markets
You agree to website policy and terms of use
I did include Parabolic SAR on the chart.
Indicator list shows that there is PSAR on the chart. But I can't see it. PSAR properties box doesn't have color change option. How can I see PSAR pattern on the chart?
The chart is shown in the attached picture.