Discussion of article "Using spreadsheets to build trading strategies"
Oleh Fedorov,
Thank you so much for writing this article . I am 75+ and have basic knowledge of Excel. But because of more than 35 years in trading, I understand datasets and how to use them for doing a probability study.
We are a group of elderly people trading in small account for fun and keeping brains alive. Creating and implementing ideas from a provability study keeps active and happy.
So I welcome your article. Kudos to you.
1. Can you please give me a tool for generating MT5 history data in a format that I can use and generate data as per spreadsheet designed.
Presently, if the indicator has export button, I am able to generate csv file which I save it as an Excel Sheet and do analysis.
I am told there is a csv making mql indicator which can use the logic of any other indicator and generate csv data in a pre-made format file which can be modified to make new spreadsheet columns.
Can you please inform where I can buy this indicator?
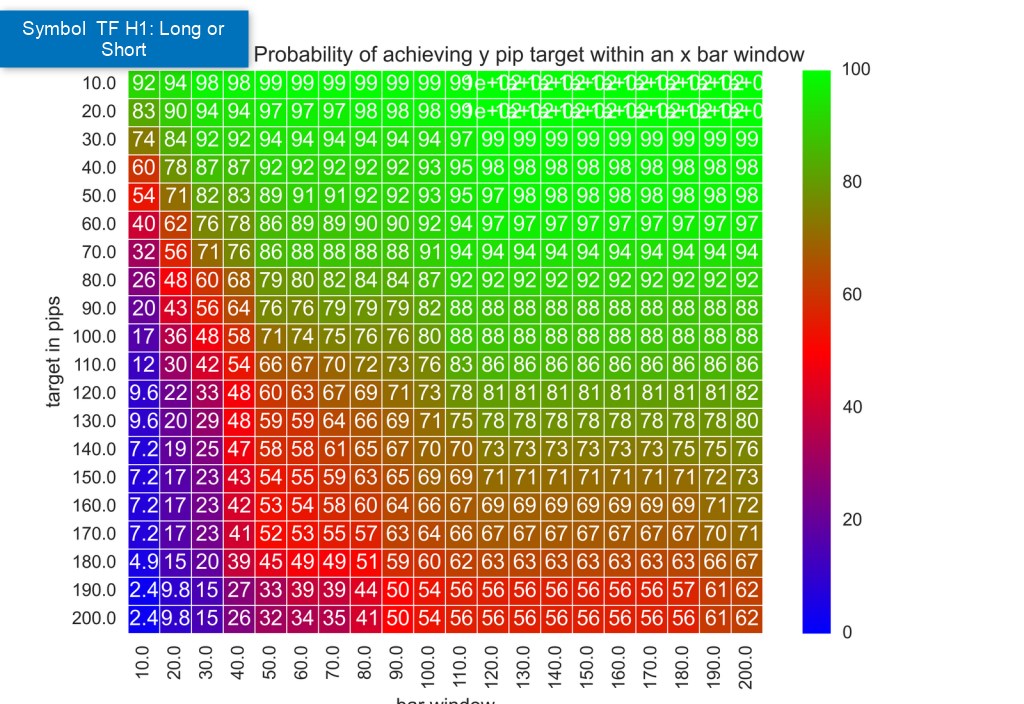
2. I want to conduct probabilities studies by creating heatmaps like this in Excel. Can you please teach this in your new article?
Example: I want to create a heatmap like this. After generating csv file through an indicator, how can I do it step by step convert it into an Excel, filter it and produce heatmaps or other reports like this attached file?
Thank you again
- Free trading apps
- Over 8,000 signals for copying
- Economic news for exploring financial markets
You agree to website policy and terms of use
New article Using spreadsheets to build trading strategies has been published:
The article describes the basic principles and methods that allow you to analyze any strategy using spreadsheets (Excel, Calc, Google). The obtained results are compared with MetaTrader 5 tester.
To analyze the strategy profitability, I need to calculate the distance traveled by the price during the trade period. The easiest way to do this is in several stages.
First, select the deal price. If a deal is opened, set the price in the column next to the signal (L) and copy it to each subsequent cell until the deal is closed. If there is no deal, then an empty line is written to the cell. The equation in L4 cell:
If the signal cell (К4) features the word "Buy", the deal open price is equal to the candle open price plus spread. If the word is "Sell", simply write the candle open price, if "Close" (or the previous column cell does not contain a number) — an empty string, and if the previous cell of the same column is a number, while the signal column contains no words, simply copy the previous cell.
Figure 10. Deal open price
Thus, we will be able to easily calculate the deal profit at the moment of closure.
Author: Oleh Fedorov