Need help to understand difference between "Backtest" tab results and "Strategy Tester Visualization" results
Close the thread.
Found the issue.
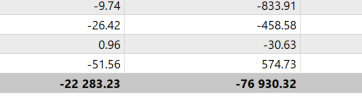
In the other tab "Deals", the discrepancies is due to Swap which is not displayed in the "Orders & Deals" tab.
You are missing trading opportunities:
- Free trading apps
- Over 8,000 signals for copying
- Economic news for exploring financial markets
Registration
Log in
You agree to website policy and terms of use
If you do not have an account, please register
On a single run in Strategy Tester, I get the following.
In the "Backtest" Tab, "Total Net Profit", I get a different figure from the "Strategy Tester Visualization" "History" Tab when you select "Orders & Deals".
See below for example.
Can anyone point me a direction to figure out why will there be a difference?
Thanks.
EA is mult-currency in case it matters. Open price only.