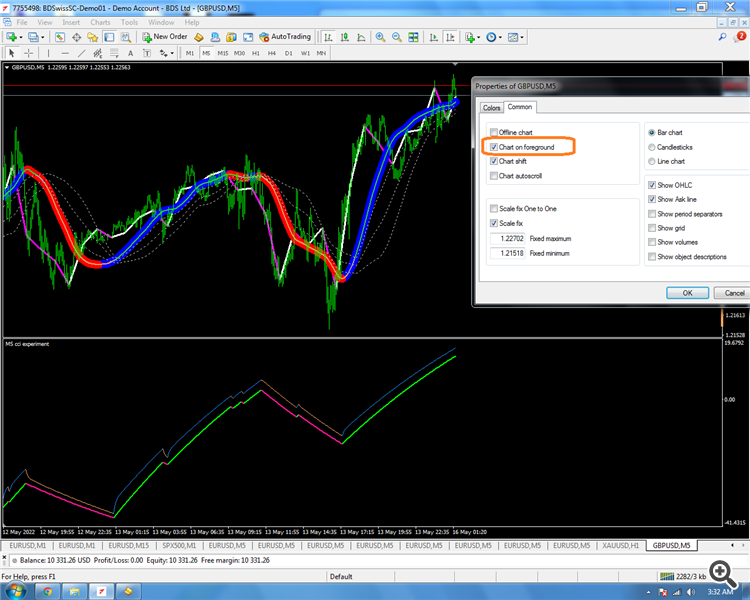
Draw the trend curve in the background behind the candlesticks


I have the following Trend Curve indicator and I would like to have it drawn in the background behind the candlesticks 
At the moment when i load it on my chart, it covers the candle sticks and appears on the foreground of the chart

Below is the code that I used 
Any help will be appreciated


//+------------------------------------------------------------------+ 
                          
//+------------------------------------------------------------------+
#property copyright "" 
#property link      "" 

#property indicator_chart_window 
#property indicator_buffers 2 
#property indicator_color1 Blue 
#property indicator_color2 Red 
//---- input parameters 
extern int       period=144; 
extern int       method=3;                         // MODE_SMA 
extern int       price=0;                          // PRICE_CLOSE 
//---- buffers 
double Uptrend[];
double Dntrend[];
double ExtMapBuffer[]; 


//+------------------------------------------------------------------+ 
//| Custom indicator initialization function                         | 
//+------------------------------------------------------------------+ 
int init() 
{ 
    IndicatorBuffers(3);  
    SetIndexBuffer(0, Uptrend); 
    //ArraySetAsSeries(Uptrend, true); 
    SetIndexBuffer(1, Dntrend); 
    //ArraySetAsSeries(Dntrend, true); 
    SetIndexBuffer(2, ExtMapBuffer); 
    ArraySetAsSeries(ExtMapBuffer, true); 
    
    SetIndexStyle(0,DRAW_LINE,STYLE_SOLID,14);
    SetIndexStyle(1,DRAW_LINE,STYLE_SOLID,14);
    
    IndicatorShortName("Hull Moving Average("+period+")"); 
    return(0); 
} 

//+------------------------------------------------------------------+ 
//| Custor indicator deinitialization function                       | 
//+------------------------------------------------------------------+ 
int deinit() 
{ 
    // ???? ????? ?????? ?????? 
    return(0); 
} 

//+------------------------------------------------------------------+ 
//| ?????????? ???????                                               | 
//+------------------------------------------------------------------+ 
double WMA(int x, int p) 
{ 
    return(iMA(NULL, 0, p, 0, method, price, x));    
} 

//+------------------------------------------------------------------+ 
//| Custom indicator iteration function                              | 
//+------------------------------------------------------------------+ 
int start() 
{ 
    int counted_bars = IndicatorCounted(); 
    
    if(counted_bars < 0) 
        return(-1); 
                  
    int x = 0; 
    int p = MathSqrt(period);              
    int e = Bars - counted_bars + period + 1; 
    
    double vect[], trend[]; 
    
    if(e > Bars) 
        e = Bars;    

    ArrayResize(vect, e); 
    ArraySetAsSeries(vect, true);
    ArrayResize(trend, e); 
    ArraySetAsSeries(trend, true); 
    
    for(x = 0; x < e; x++) 
    { 
        vect[x] = 2*WMA(x, period/2) - WMA(x, period);        
 //       Print("Bar date/time: ", TimeToStr(Time[x]), " close: ", Close[x], " vect[", x, "] = ", vect[x], " 2*WMA(p/2) = ", 2*WMA(x, period/2), " WMA(p) = ",  WMA(x, period)); 
    } 

    for(x = 0; x < e-period; x++)
     
        ExtMapBuffer[x] = iMAOnArray(vect, 0, p, 0, method, x);        
    
    for(x = e-period; x >= 0; x--)
    {     
        trend[x] = trend[x+1];
        if (ExtMapBuffer[x]> ExtMapBuffer[x+1]) trend[x] =1;
        if (ExtMapBuffer[x]< ExtMapBuffer[x+1]) trend[x] =-1;
    
    if (trend[x]>0)
    { Uptrend[x] = ExtMapBuffer[x]; 
      if (trend[x+1]<0) Uptrend[x+1]=ExtMapBuffer[x+1];
      Dntrend[x] = EMPTY_VALUE;
    }
    else              
    if (trend[x]<0)
    { 
      Dntrend[x] = ExtMapBuffer[x]; 
      if (trend[x+1]>0) Dntrend[x+1]=ExtMapBuffer[x+1];
      Uptrend[x] = EMPTY_VALUE;
    }              
    
    //Print( " trend=",trend[x]);
    }
    
    return(0); 
} 
//+------------------------------------------------------------------+ 
 
Please edit your post and

use the code button (Alt+S) when pasting code

I know that it is not obvious, but topics concerning MT4 and MQL4 have their own section.

In future please post in the correct section.

I will move your topic to the MQL4 and Metatrader 4 section.

 
Keith Watford:
Please edit your post and

use the code button (Alt+S) when pasting code

I know that it is not obvious, but topics concerning MT4 and MQL4 have their own section.

In future please post in the correct section.

I will move your topic to the MQL4 and Metatrader 4 section.

Thanks for notifying me 

 
leagawa:

I have the following Trend Curve indicator and I would like to have it drawn in the background behind the candlesticks 
At the moment when i load it on my chart, it covers the candle sticks and appears on the foreground of the chart

Below is the code that I used 
Any help will be appreciated


First,it is simply an Hull moving average (HMA) indicator and can be managed/displayed in background by chart property

though so late replying - :)

hull