Indicators: WPR_2HTF
Forum on trading, automated trading systems and testing trading strategies
newdigital, 2014.03.31 12:17
Williams Percent R Technical Indicator
Williams %R Technical Indicator Developed by Larry Williams
Williams %R indicator is pronounced as Williams percent R indicator. Williams %R Technical Indicator is a momentum oscillator used to analyze overbought and oversold levels in the Forex markets.
The Williams % Range oscillator is similar to the Stochastic Oscillator indicator, apart from that fact that the %R is plotted upside down on a negative scale that is from 0 to -100 and the indicator does not apply a smoothing factor.
The Williams %R indicator analyses the association of the closing prices relative to the High and Low range over a selected number of n candlesticks.
- The closer the closing price of a candlestick is to the highest high of the range selected the closer to zero the %R reading will be.
- The closer the closing price of a candlestick is to the lowest low of the range selected the closer to -100 the %R reading will be.
When doing technical analysis a trader should ignore the minus sign placed before the value, for example -40, the - sign should be ignored, just remember the indictor values are placed in an upside down manner.
- At zero: If the closing price of the candlestick is equal to the highest high of the range the William %R reading will be 0.
- At -100: if the closing price of the candlestick is equal to the lowest low of the range the William %R reading will be -100.
Technical Analysis of Williams Percent R Technical Indicator
Overbought/Oversold Levels
- Overbought- Williams %R values from 0 to -20 are considered overbought while
- Oversold- Williams %R values from -80 to -100 are considered oversold.
As for trading overbought/oversold levels it is best to wait for a currency pair to change direction before taking a signal in the opposite direction. For Example if a currency pair is oversold it is best to wait for the trend to reverse and start to head in an upward direction before buying the currency pair.
Forum on trading, automated trading systems and testing trading strategies
newdigital, 2013.04.01 12:53
Stochastic indicator (Sto.chas.tic - sto kas'tik) was invented by C. Ralph Dystant (1902-1978) and George C. Lane (1921-2004). WPR was invented by Larry Williams but he uses Stochastic in some cases as an example of WPR :)
But Stochastic is more developed by many versions and more used than WPR for example.
Forum on trading, automated trading systems and testing trading strategies
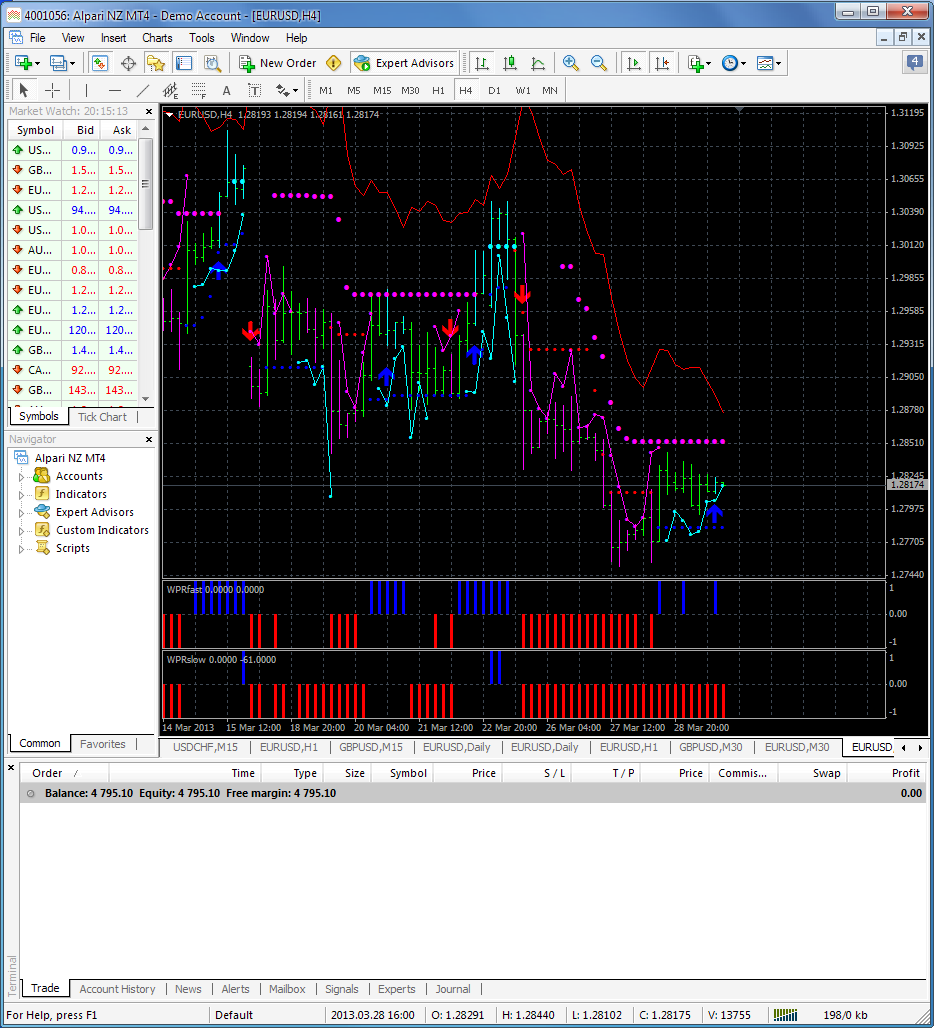
newdigital, 2013.03.29 19:22
You can see - this is classical asctrend (very very first one) - MT4:
Forum on trading, automated trading systems and testing trading strategies
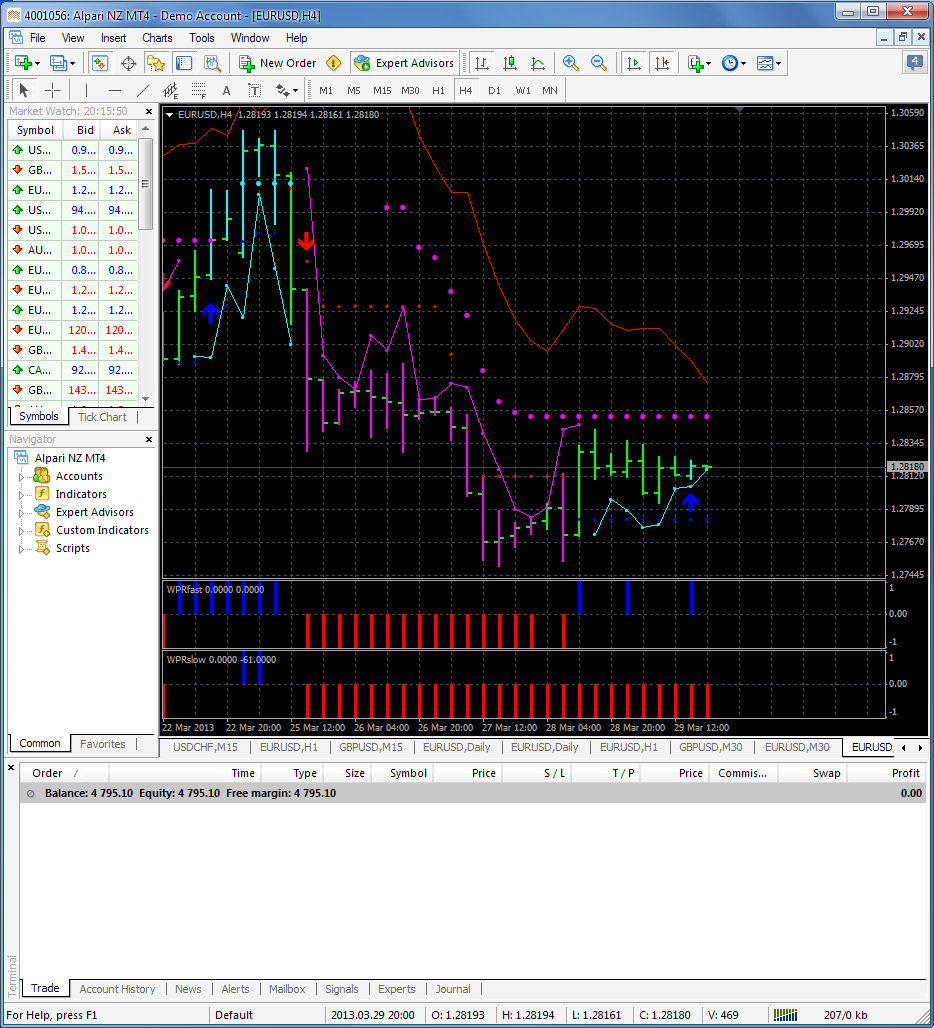
newdigital, 2013.03.29 19:29
And this is Asctrend indicator and template for MT4 - attached.
- Free trading apps
- Over 8,000 signals for copying
- Economic news for exploring financial markets
You agree to website policy and terms of use
WPR_2HTF:
A colored cloud formed by two WPR (Williams' Percent Range) oscillators with different timeframes.
Author: Nikolay Kositsin