ChartIndicatorAdd() in MT4 - page 2
You are missing trading opportunities:
- Free trading apps
- Over 8,000 signals for copying
- Economic news for exploring financial markets
Registration
Log in
You agree to website policy and terms of use
If you do not have an account, please register
Thank you Seng, but if I do that the BB values dosen´t match the RSI values Do you know what I mean? So the indicator is not shown properly.
You mean the value range? Just remove the #property indicator_maximum and #property indicator_minimum lines will do.
If I do that nothing happens and it is because by default the RSI goes from 0 to 100.
You mean the value range? Just remove the #property indicator_maximum and #property indicator_minimum lines will do.
BB values are prices and RSI values are percentages from 0 to 100. Any idea how can I convert BB values to percentages between 0 to 100.?
If I do that nothing happens and it is because by default the RSI goes from 0 to 100.
BB values are prices and RSI values are percentages from 0 to 100. Any idea how can I convert BB values to percentages between 0 to 100.?
The bands take on values of the source data.
This is what I have done, simply changed RsiBuffer for close buffer. Nothing changed.
This is what I have done, simply changed RsiBuffer for close buffer. Nothing changed.
Two issues:
(1) When you insist on putting RSI and BB (on close prices) together, you're bound to see meaningless results because they are of different ranges (will be different if you run BB based on RSI data instead).
(2) You should check _LastError to find out the error generated by iBandsOnArray(), since it obviously gave you all zeros. And if you checked, the error was 4029, which implies the array you supplied were not acceptable (so you cannot send a const double close[] into a function which only accepts double &close[]). To fix that, just create a 5th buffer to store close[], then feed that new buffer to iBandsOnArray(), and you'll get (red line is close price):
Now, if you still insist on showing RSI together, it'll just be a simple case of scale the values - that's basic arithmetic which I'm sure you are capable of.
Hi, Seng.
Sorry for the delay, I was in other stuffs. As you mention I have tested what you said about error 4029, but still not working. I also tried what I mentioned before about scaling and this is my result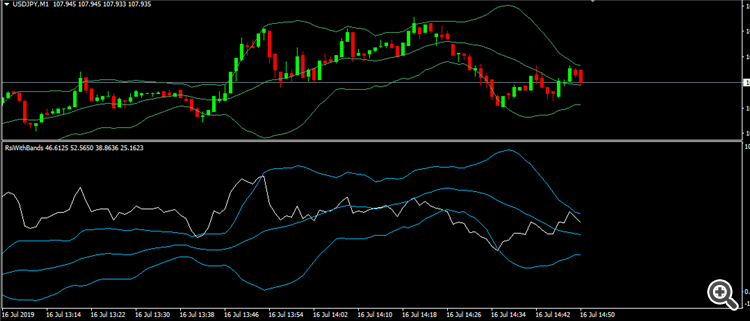
Now they are the same,the next, I would like to move the BB when I scroll or drag the chart rightwards just like MT5 does, because the BB values overflow the RSI values, I mean, they are greater than 100 or less than 0. I would like to keep the BB between 0 and 100.
On error 4029, if you show your code, I can see where the bug is.
As for scaling, your results were expected. In fact, your results are better than on MT5... because if you look at MT5 - the relative positions of BB and RSI changes not only as you scroll, but also when you zoom in/out. Here's an example:
First picture shows USDJPY-M1 when I zoom all the way in - notice the upper bands (in green) and rsi. In second picture I zoom all the way out - notice the bands shifted.
So I really don't see any benefit in showing them in the same sub-window, since they're ranged differently to serve their original purposes. But if your rationale is to save screen space... hmm... how about getting a bigger screen? (LOL)