Hi all,
Does anyone know if there is a possibility to calculate Trend Line without the need to create it on the chart?
Thanks,
Of course. A trend line is an ordinary line which is described by following formula y=k.x+q where "y" is the price axis and "x" the time axis. You need to determine two points and you can calculate the coefficients "k" and "q". If you get the coefficients you can easily calculate any point on this line. But you should use a bar's number instead of time because of the inconsistent time axis (weekends, missed bars...).
Of course. A trend line is an ordinary line which is described by following formula y=k.x+q where "y" is the price axis and "x" the time axis. You need to determine two points and you can calculate the coefficients "k" and "q". If you get the coefficients you can easily calculate any point on this line. But you should use a bar's number instead of time because of the inconsistent time axis (weekends, missed bars...).
Thanks Petr,
But I didn't understand something, what are the "k" and "q" means?
Can you give an example, please?
Thanks Petr,
But I didn't understand something, what are the "k" and "q" means?
Can you give an example, please?

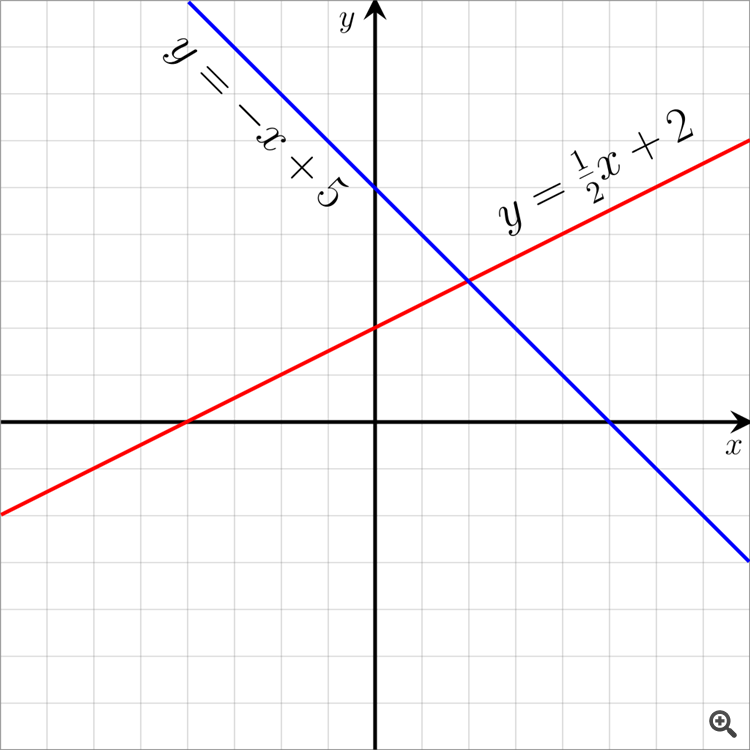
"k" for the red line is 1/2 and for the blue line -1
"q" for the red line is 2 and for the blue line 5
In general, "k" is a tangent angle between the line and axis x and "q" is a shift on axis y.
For example, if you want to have a trend line which connects two lows on a graph with just ten candles. The first low is on the tenth candle from the right (from the newest) then the first low candle has the index 9 (in MQL4 the current candle has the index 0) and the second low is on the fifth candle (index 4). The first low price is 100 and second low is 105. IfThen k=(the second low-the first low)/number of candles between the lows=(105-100)/5=1 and q=the first low=100 . Now you can compute the price on the trend line on the current candle => y=k.x+q=1*9+100=109
Got it Petr, very helpful, thank you very much!!
- Free trading apps
- Over 8,000 signals for copying
- Economic news for exploring financial markets
You agree to website policy and terms of use
Hi all,
Does anyone know if there is a possibility to calculate Trend Line values without the need to create it on the chart?
Thanks,