Transforming an histogram/oscillator into a 0 to 100 range indicator
- Trouble scaling Moving Average into the 0-100 scale subwindow
- Elite indicators :)
- Apply the moving average and RSI on a custom indicator
double BearsVsBullsPower(string symbol=NULL,int timeframe=0,int period=13,int applied_price=PRICE_CLOSE,int shift=0)
{
   double bears=iBearsPower(symbol,timeframe,period,applied_price,shift); // ranges 0..100
   double bulls=iBearsPower(symbol,timeframe,period,applied_price,shift); // ranges 0..100
   return bulls-bears; // ranges -100..100, -100 full bears, 100 full bulls
}
Just an idea. Expand on it.
Just an idea. Expand on it.
Thank you for your idea, but I am bad at coding and don't know what to do about this, everything I tried failed lol
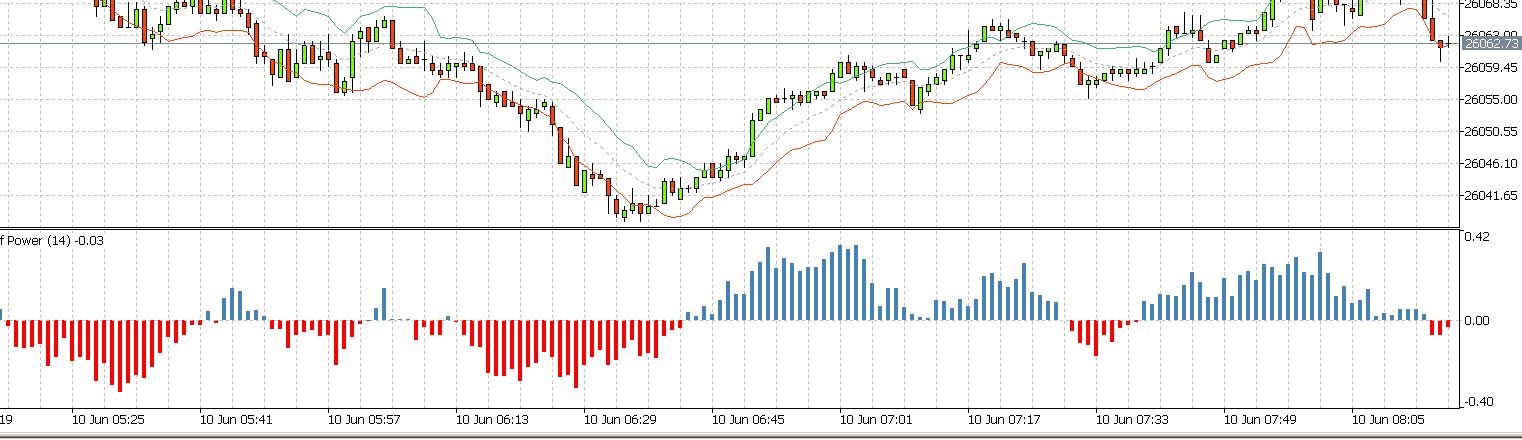
Neither bulls power nor bears power are ranging in 0..100 range
They would need to be normalized - which means that they would lose their original values
Neither bulls power nor bears power are ranging in 0..100 range
They would need to be normalized - which means that they would lose their original values
Thank you for your idea, but I am bad at coding and don't know what to do about this, everything I tried failed lol
The formula to compute Bulls / Bears power is
Bulls = CurrentHigh - EMA(13);
Bears = CurrentLow - EMA(13);
If we combine these values by subtraction we get
BullsMinusBears = CurrentHigh - CurrentLow;
which is sort of a measure for volatility.
If we combine by addition we get
BullsAndBears = CurrentHigh + CurrentLow - 2*EMA(13);
which is roughly the same as 2 * MACD(1,13,X) that means MACD here is computed by EMA(1) - EMA(13), median price mode. (X being the signal period which is of no concern here)
It's questionable if it makes any sense to transform the result into a 0..100 range where 50 represents the zero line.
I recommend to give this indicator a try: https://www.mql5.com/en/forum/9276
It combines Bulls and Bears power in a similar fashion but retains the smoothing (EMA of Bulls/Bears will become a SMA) until the outcome of the candle in question is met.
It's oscillating between 1 and -1. You can transform the result into a range between 0..100 by this formula:
input int BOP_Period = 14;       //--- smoothing period
int BOP_Handle;

int OnInit()
 {
    BOP_Handle = iCustom(NULL, 0, "balance_of_power", BOP_Period);
    ...
    return INIT_SUCCEEDED;
 }

void OnTick
 {
    static double s_val[1];
    int shift=0;
    int amount=1;
    if(CopyBuffer(BOP_Handle,MAIN_LINE,shift,amount,s_val)!=amount) { Print("BOP CopyBuffer error: ",GetLastError()); ExpertRemove(); return; }
    double bopval=s_val[0]; // -1..1
    double result=(bopval * 50.0) + 50.0; // 0..100
    ...
 }

- Free trading apps
- Over 8,000 signals for copying
- Economic news for exploring financial markets
You agree to website policy and terms of use