        Above[pos] = fast;
        if(Above[pos+1] == EMPTY_VALUE) Above[pos+1] = Below[pos+1]; // Connect the lines.
        Below[pos] = EMPTY_VALUE;
whroeder1:
Thanks for the answer but not working............. Any other idea to achieve what I target to achieve??
Try setting your "Bars/Candles" to "Background"....
Right "Click" on your chart... select Properties... "Uncheck" "Chart On Foreground"... I think...
...and what whroeder1 said if you only want the line "Color" to change on a new candle...
remark you are using mql4 reserved word Period (in violet)
extern int Period=5;
pbk4:
Hi all, I want to change color of custom indicator dynamically based on close price. Below is the code snippet.
If I add above indicator, following will come as output:
Any idea how to solve this breaking of lines???
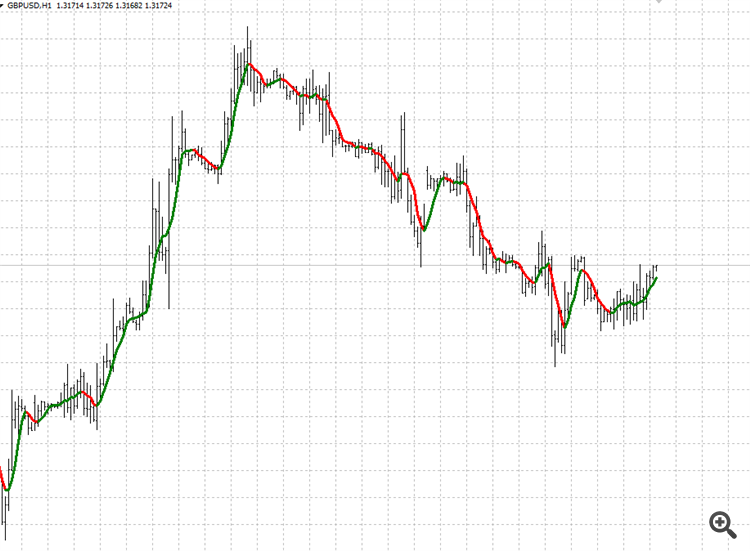
code shoud look like below. trick is You have to first populate buffer array and then revers counting to make buffer draw a line without brakes
//+------------------------------------------------------------------+
//|                                                   MAresolved.mq4 |
//|                                                  Wojciech Kuczer |
//|                                             https://www.mql5.com |
//+------------------------------------------------------------------+
#property copyright "Wojciech Kuczer"
#property link      ""
#property version   "1.00"
#property strict
#property indicator_chart_window

#property indicator_buffers 2
#property indicator_color1 Red
#property indicator_color2 Green
//--- input parameters
extern int       period=5;
//--- buffers
double Above[],Below[],temp[];
//+------------------------------------------------------------------+
//| Custom indicator initialization function                         |
//+------------------------------------------------------------------+
int OnInit()
  {
//--- indicator buffers mapping
   IndicatorBuffers(3);

   SetIndexBuffer(0,Above);
   SetIndexBuffer(1,Below);
   SetIndexBuffer(2,temp);
   SetIndexStyle(0,DRAW_LINE,STYLE_SOLID,3);
   SetIndexStyle(1,DRAW_LINE,STYLE_SOLID,3);
   SetIndexStyle(2,DRAW_NONE);
   SetIndexLabel(0,"Above");
   SetIndexLabel(1,"Below");
//---
   return(INIT_SUCCEEDED);
  }
//+------------------------------------------------------------------+
//| Custom indicator iteration function                              |
//+------------------------------------------------------------------+
int OnCalculate(const int rates_total,
                const int prev_calculated,
                const datetime &time[],
                const double &open[],
                const double &high[],
                const double &low[],
                const double &close[],
                const long &tick_volume[],
                const long &volume[],
                const int &spread[])
  {
//---
   int pos;
   int limit;
   if(!prev_calculated)limit=rates_total-period;
   else limit=rates_total-prev_calculated;
//----
   for(pos=0; pos<=limit; pos++)
     {
      temp[pos]=iMA(Symbol(),Period(),period,0,MODE_SMA,PRICE_CLOSE,pos);

     }

   for(int i=limit;i>=0;i--)
     {
      //if(Close[i]>temp[i])
      //  {
      //   Below[i]=temp[i];
      //   Below[i+1]=temp[i+1];
      //   Above[i]=EMPTY_VALUE;
      //  }
      //else
      //  {
      //   Above[i]=temp[i];
      //   Above[i+1]=temp[i+1];
      //   Below[i]=EMPTY_VALUE;
      //  }

      if(temp[i]>temp[i+1])
        {
         Below[i]=temp[i];
         Below[i+1]=temp[i+1];
         Above[i]=EMPTY_VALUE;
        }
      else
        {
         Above[i]=temp[i];
         Above[i+1]=temp[i+1];
         Below[i]=EMPTY_VALUE;
        }
     }

//--- return value of prev_calculated for next call
   return(rates_total);
  }
//+------------------------------------------------------------------+
Hope it helps
You are missing trading opportunities:
- Free trading apps
- Over 8,000 signals for copying
- Economic news for exploring financial markets
Registration
Log in
You agree to website policy and terms of use
If you do not have an account, please register

Hi all, I want to change color of custom indicator dynamically based on close price. Below is the code snippet.
If I add above indicator, following will come as output:
Any idea how to solve this breaking of lines???