Indicators: Professional ZigZag
Forum on trading, automated trading systems and testing trading strategies
newdigital, 2013.09.26 08:26
The Zig-Zag indicator is extremely useful for determining price trends, support and resistance areas, and classic chart patterns like head and shoulders, double bottoms and double tops. The Zig-Zag indicators uses both swing highs and swing lows in its calculation:
- Swing Highs: When a price (usually close) is both higher than the price previous to it and after it.
- Swing Lows: When a price is both lower than the price prior to it and lower than the price following it.
The Zig-Zag indicator can use both percentages or points in its construction. To construct the Zig-Zag indicator, there must be a certain percentage or number of points between a swing high and a swing low before a line will be drawn. The chart below of the E-mini Nasdaq 100 Futures contract visually illustrates the difference between a price retracement Zig-Zag of 3% and a price retracement Zig-Zag of 5%:
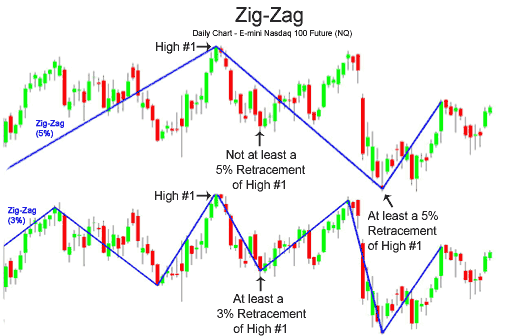
Notice how in the chart above that a Zig-Zag with a retracement percentage of 3%
makes more distinct lines than the Zig-Zag with a retracement percentage of 5%.
The purpose of using a Zig-Zag with a larger retracement percentage is to help
eliminate price noise that is not significant for the trader's analysis.
Zig-Zag indicator is extremely effective at uncovering stock cycles while screening out short-term price noise.
The Zig-Zag indicator is extremely effective in filtering short-term noise and identifying significant trends and significant changes in market prices.
Below is a chart of the E-mini S&P 500 Futures contract that illustrates how effective the Zig-Zag indicator was in finding areas of support and resistance and price breakouts:
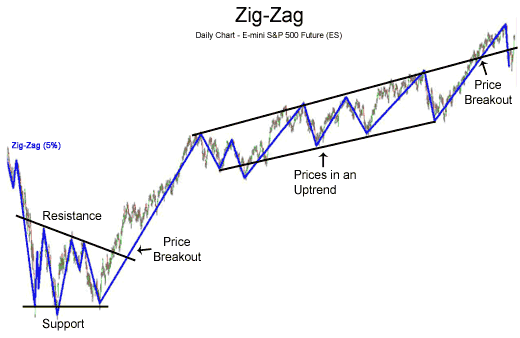
The chart above of the e-mini uses a 5% Zig-Zag retracement value; therefore, only price changes of 5% or greater are shown, helping a long-term trader or investor determine important areas of support, resistance, and areas of price breakouts.
On the left of the chart, the S&P 500 was forming a triangle consolidation pattern. When prices broke resistance, a long-term buy was generated. During the middle of the chart, the Zig-Zag indicator was effective in illustrating that the S&P 500 was in an upward price channel. Buying in areas where price touched the lower support trendline and selling when prices touched the upper resistance line would have proved extremely profitable.
Using the Zig-Zag indicator for shorter-term trades can prove profitable as well. The chart below of Intel (INTC) shows a classic chart head and shoulder pattern easily seen by the Zig-Zag indicator ($1 retracement):
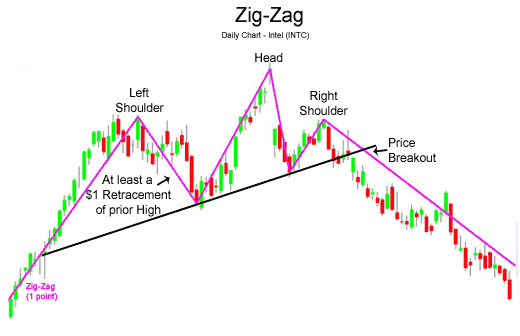
The easily identified head and shoulders pattern gave a sell signal when price on the right shoulder broke the upward slanting trendline.
The Zig-Zag indicator is an excellent technical analysis tool for identifying classic charting patterns. The Zig-Zag indicator is also effective in reducing noise and helping the technical trader see the true market direction.
Excellent indicator, thanks for sharing!
Great job Alexandr!
I'm not a professional coder, but I can analyse the data and I can confirm that your version of this indicator works in the best way among the other versions.
Unlike the original MT4 indicator it work fine in the Strategy Tester, it detects all the spikes and to put simply it just does the job.
Thanks very much for your effort.
I would like to use your indicator in my EA, and I need to extract from the ZZ the last point of support (both up and down),
I checked the buffers 0-4, and none of them keeps this value, I don't quite get where some values came from, ie (Gold, 15 Jul 2019, 8:30 AM, 1M chart):
Buffer value 0 = 1412.27
Buffer value 1 = 2147483647
Buffer value 2 = 2147483647
Buffer value 3 = 1412.27
Buffer value 4 = 1412.16
The last value (1412.16) is not any high nor low, it's a "extra" buffer.
But I would like to get just one value showing the last confirmed value (that is to say from a closed candle) to use it in further calculations.
I'm using MT4 version of your code, but the buffers will work the same on both I suppose.
Let me give a clean example- original ZigZag has only one buffer, and it stores the last high or low support point up until the next is confirmed, I would like to extract exactly the same information from your code- will you be so kind and give me some advice regarding the method of doing that?
Fantastic work, thank you very much for sharing this gem!
(Sorry for the necro post, considering how old the original is, but just had to give credit where it is due)
- Free trading apps
- Over 8,000 signals for copying
- Economic news for exploring financial markets
You agree to website policy and terms of use
Professional ZigZag:
I think that ZigZag is something like compression of the price chart. The ZigZag can be calculated using the price of the bar (for example, Close price) or High/Low prices of the bar (the most common used method)
While working with the standard ZigZag, proposed by MetaQuotes, I have found some errors. The main problem is that standard ZigZag doesn't proceed the case of the outside bar.
In 2007 Rashid Umarov (Rosh) have published the Zigzag2 R code with outside bar processing (DRAW_ZIGZAG style instead of DRAW_SECTION).
Let's define the features of the "correct" ZigZag implementation:
- The Highs and Lows must be strictly alternated;
- The High must be higher (or equal) among the all bars on the right side until the next (opposite) Low;
- The Low must be lower (or equal) among the all bars on the left side until the next (opposite) High.
Let's consider using the example (EURUSD, H1, 2006, December 8-13). Here we have two cases with the outside bar. The typical ZigZag cannot constuct the "correct" picture.Author: Александр