Indicators: On Balance Volume (OBV)
This indicator was introduced by Joe Granville in 1963 and he stated that it measures the buying and selling pressure. What’s more, his theory stated that the volume moves faster than the actual price, but this is all theory, without any hard evidences. The important moment here is that the OBV can successfully determine the trends direction and strength. The difference between the OBV and most of the oscillators is the algorithm being used. The momentum indicators primarily use moving averages, while OBV is being calculated entirely on the volume values.
The formula is pretty simple. If we have a price that has closed at a higher point that the previous one, then the volume of the former period is added to the current OBV value and vice versa or: current OBV = former OBV + current volume value OR current OBV = former OBV – current volume value. A logic question here is “what is the initial value of OBV?” The default settings in the trading platforms don’t use specific start and end period, so the initial value of the OBV is the value of the volume of the most distant period that has any records. Surely, you can specify either start period, end period or even both, but we recommend sticking with the defaults.
Use in Forex
This indicator works pretty much the same way as any normal oscillator. So you can highlight strong levels either resistance or support on the OBV and then you can use divergence to spot a possible reversal or a trend confirmation. The whole idea here is based on the theory that the volume precedes the price.
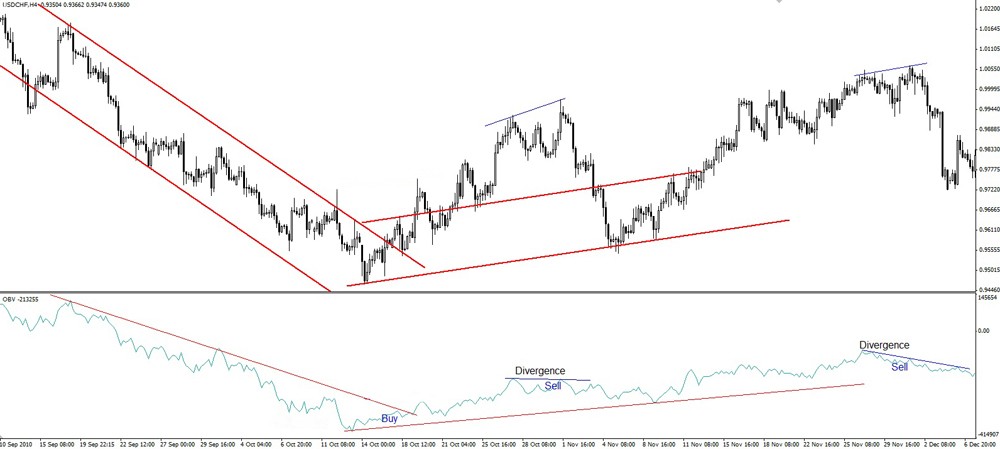
Take a look at the image. There you can notice the support and resistance levels are clearly defined in the indicator. These levels confirm the direction the trends and that is how we know that the trend is strong enough. However, take look at the buy signal. Here we can see the price breaking the resistance and here we have our first buy signal. But you are way to experienced now to enter set an order on just one single, so you will search or at least one other confirmation via different indicator. Moving on we notice the first divergence and as you know from the divergence page in the Oscillators section, this is a signal for sell, because the indicator’s line is rather flat and the price’s line is showing an up-trend.
And finally, on the right side of the image, you can see yet another example of a divergence that indicates a sell signal.
We strongly recommend combining the OBV with MACD and a couple of moving averages (14 and 89, for example). These indicators are a powerful combination that will surely provide you all the necessary signals for profitable orders.
This indicator was introduced by Joe Granville in 1963 and he stated that it measures the buying and selling pressure. What’s more, his theory stated that the volume moves faster than the actual price, but this is all theory, without any hard evidences. The important moment here is that the OBV can successfully determine the trends direction and strength. The difference between the OBV and most of the oscillators is the algorithm being used. The momentum indicators primarily use moving averages, while OBV is being calculated entirely on the volume values.
- Free trading apps
- Over 8,000 signals for copying
- Economic news for exploring financial markets
You agree to website policy and terms of use
On Balance Volume (OBV):
On Balance Volume technical indicator (OBV) is a momentum technical indicator that relates volume to price change.
The indicator, which Joseph Granville came up with, is pretty simple. If the close price of the current bar is higher than that of the previous bar, the volume of the current bar is added to the previous OBV. If the current bar close price is lower than of the previous one, the current volume is subtracted from the previous OBV.
The basic assumption, regarding On Balance Volume analysis, is that OBV changes precede price changes. The theory is that smart money can be seen flowing into the security by a rising OBV. When the public then moves into the security, both the security and the On Balance Volume will surge ahead.
The OBV is in a rising trend when each new peak is higher than the previous peak and each new trough is higher than the previous trough. Likewise, the On Balance Volume is in a falling trend when each successive peak is lower than the previous peak and each successive trough is lower than the previous trough. When the OBV is moving sideways and is not making successive highs and lows, it is in a doubtful trend.
When the OBV changes to a rising or falling trend, a "breakout" has occurred. Since OBV breakouts normally precede price breakouts, investors should buy long on On Balance Volume upside breakouts. Likewise, investors should sell short when the OBV makes a downside breakout. Positions should be held until the trend changes.
Author: MetaQuotes Software Corp.