What is wrong with my indicator?
Ziad El:
Can you help me, please?
Instead of your part of code:
#property indicator_width2 Cyan
#property indicator_width3 Green
try this:
#property indicator_color3 Cyan
#property indicator_color4 Green
Thank you Petr,
that solved one problem...
But what about lines being straight?
Ok I found the mistake..
This is my first indicator, so I was very confused and forgot basic things...
MomentK[i]  = iStochastic(NULL,0,    MK,MD,MSlow,0,0,MODE_MAIN,i);
MomentD[i]  = iStochastic(NULL,0,    MK,MD,MSlow,0,0,MODE_MAIN,i);
CycleK[i]   = iStochastic(NULL,0,    CK,CD,CSlow,0,0,MODE_MAIN,i);
CycleK[i]   = iStochastic(NULL,0,    CK,CD,CSlow,0,0,MODE_MAIN,i);
FractalK[i] = iStochastic(NULL,TimeF,FK,FD,MSlow,0,0,MODE_MAIN,i);
FractalD[i] = iStochastic(NULL,TimeF,FK,FD,MSlow,0,0,MODE_MAIN,i);
}
I should have inserted "i" for the shift...
You are missing trading opportunities:
- Free trading apps
- Over 8,000 signals for copying
- Economic news for exploring financial markets
Registration
Log in
You agree to website policy and terms of use
If you do not have an account, please register
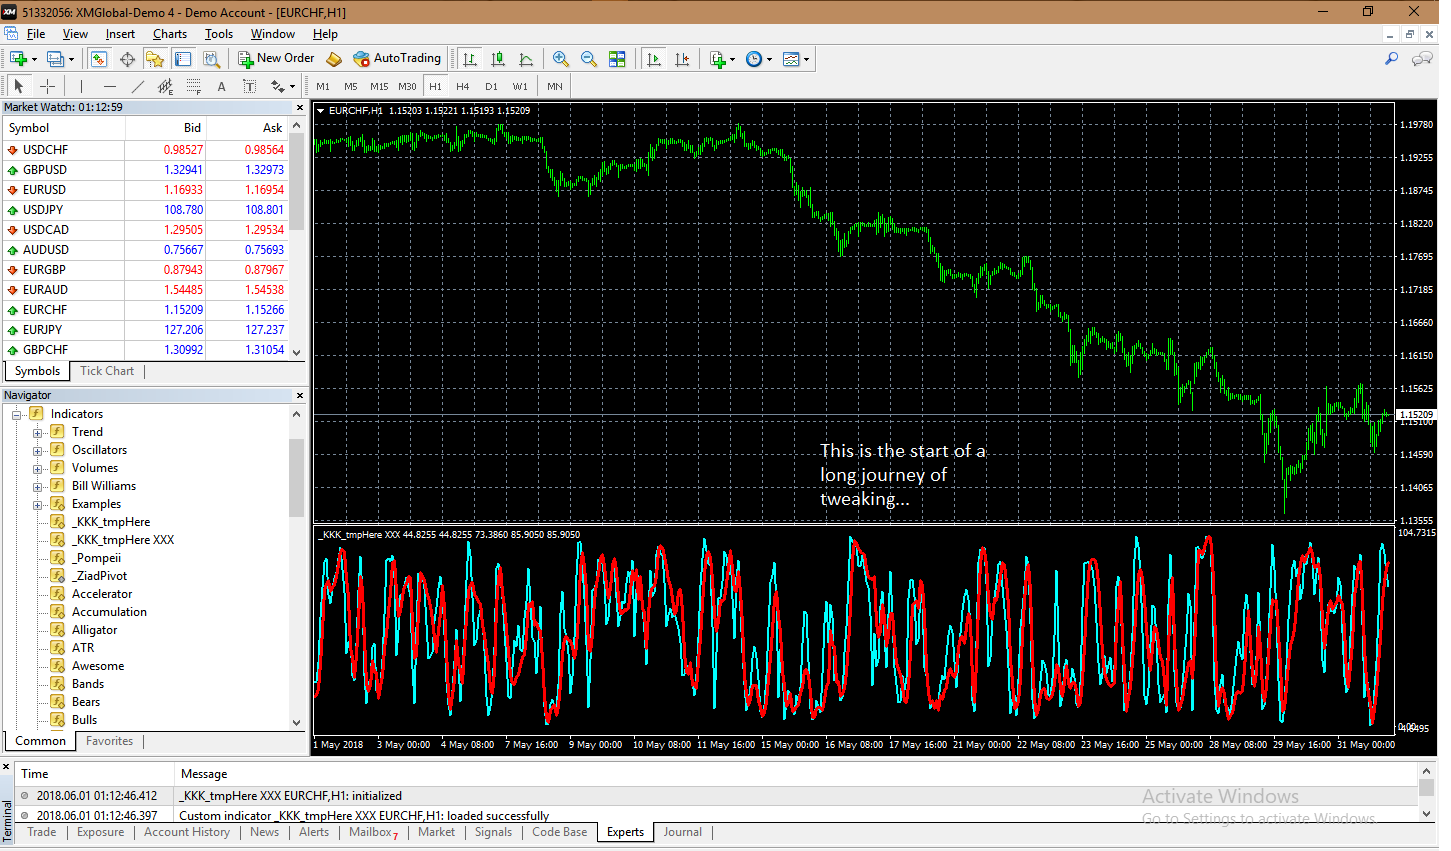
I am trying to write an indicator that draws 3 Stochastics curves on the same subwindow:
1. First one to show moment of the current time frame
2. Second one is to show cycle in the current time frame (reduced period...)
3. Third one is to show moment on a bigger time frame
However I am having ugly results, possibly a bug? (image attached)
My code is as follows:
Can you help me, please?