Indicators: Schaff Trend Cycle
Forum on trading, automated trading systems and testing trading strategies
Indicators: Schaff Trend Cycle
newdigital, 2013.07.30 08:50
There are a lot of trading systems based on this indicator. So, this is the one of them :
Schaff Trend Cycle with EMA 100
1. Time Frame: 15 min and above
2. Pairs: Any
3. Indicators:
- Schaff Trend Cycle
- Ema 100
- Stochastich (21, 9,9)
Rules to enter a long trade
- The 100 exponential moving average is sloping up.
- Wait for the Schaff Trend Cycle to reach oversold territory on the chart (-10 +10), go long when the Schaff Trend Cycle turns back above 10, and Stocastich crosses line up
- Place stop 10 pips below the most recent level of support.
- Take profit: Close the trade if the Schaff Trend Cycle indicator goes below 90
Rules to enter a short trade
- The 100 exponential moving average is sloping down
- Wait for the Schaff Trend Cycle to reach overbought territory on the chart (90-110), go short when the Schaff Trend Cycle turns back below 90, and Stocastich crosses line down.
- Place stop 3 pips above the most recent level of resistance.
- Take profit: Close the trade if the Schaff Trend Cycle indicator moves down to -10 and then rises back above +10
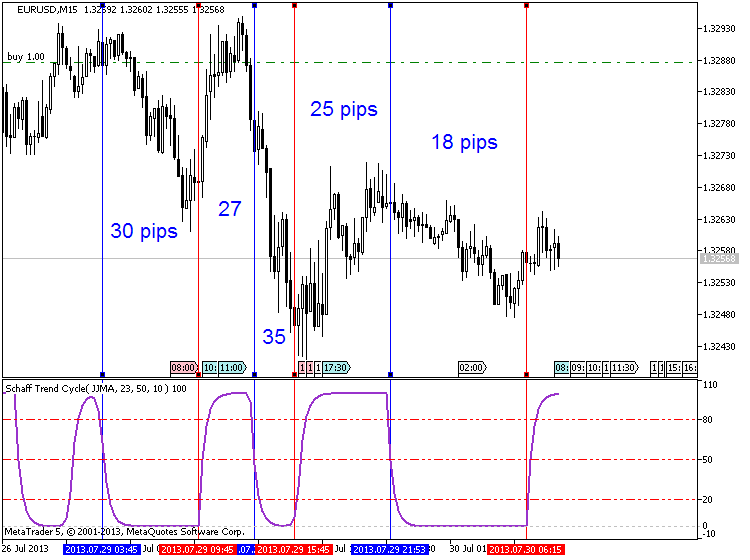
Template is attached. If you instal indicatiors and use this template so you will get the chart like that:
MetaTrader Trading Platform Screenshots
MetaQuotes Software Corp., MetaTrader 5, Demo
schaff ema 100
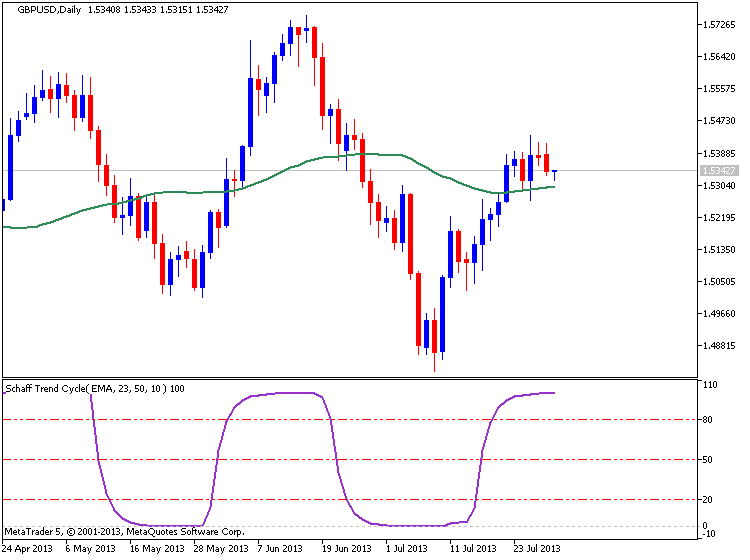
The system is really very profitable - look at the other chart with D1 timeframe: +439 pips (4 digit pips) :
MetaTrader Trading Platform Screenshots
MetaQuotes Software Corp., MetaTrader 5, Demo
439 pips in profit

Forum on trading, automated trading systems and testing trading strategies
Indicators: Schaff Trend Cycle
newdigital, 2013.07.30 09:33
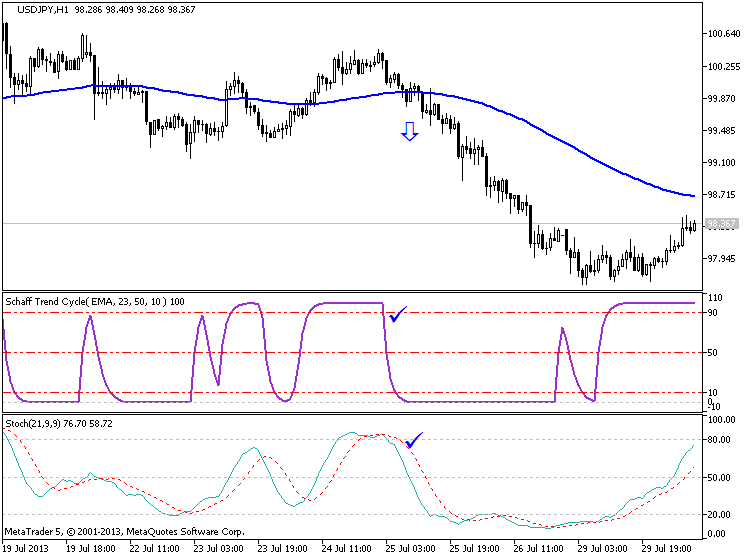
This is the other trading system taken from here :
Schaff Trend Cycle Strategy : Here is a strategy which looks for a rising 50 SMA and a rising Schaff Trend to enter long positions. It will enter shorts when the 50 SMA is moving lower as is the Schaff Trend.
To instal it - you just need one Schaff Trend Cycle indicator, and template file (attached):
- Place Schaff Trend Cycle to indicators folder (for example to C:\Program Files\MetaTrader 5\MQL5\Indicators),
- and place template file to templae folder (for example to C:\Program Files\MetaTrader 5\Profiles\Templates),
- restart Metatrader 5 or compile Schaff Trend Cycle indicator in MetaEditor,
- open any chart, right mouse click and select our template by name, and you will have the charts like that:
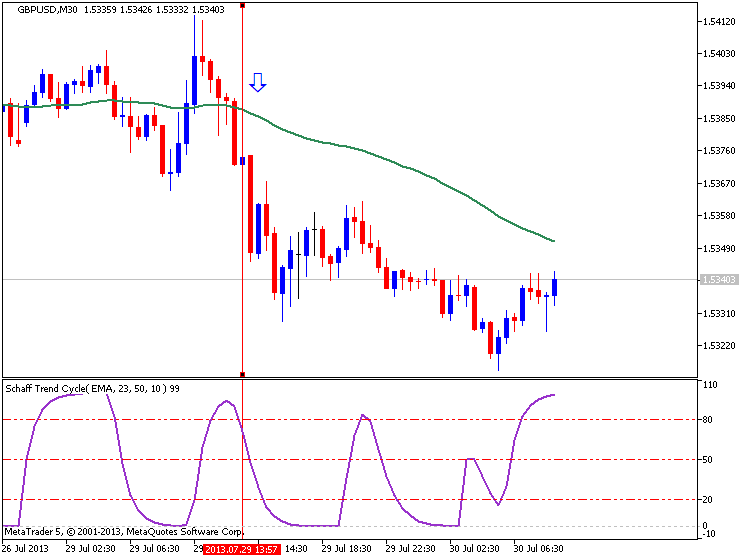
Please note that this system is also using overbought/oversold levels of Schaff Trend Cycle indicators.
Forum on trading, automated trading systems and testing trading strategies
Indicators: Schaff Trend Cycle
newdigital, 2013.07.30 09:42
It may be many variations of this simple Schaff system but most of them are related to overbought/oversold levels of this indicator. So, what are overbought/oversold levels and how to use them? Read this small article :
============
Here’s What You Need to Know about "Overbought" and "Oversold" :
If you are cooking something and you check on it and you see that it is “overdone”, what is your immediate reaction? Exactly…you take the dish out of the oven. Remove it from what caused its current overdone state and the sooner the better.
What if your car’s engine is “overheated”? Same deal…you do what it takes to get the engine cooled down. Immediately stop doing what caused the engine to become overheated in the first place.
Given these natural reactions, it is easy to see why the initial and almost immediate reaction by many newer traders to an overbought or oversold trading scenario is to do the opposite in that case as well.
They reason that since many buy (long) orders moved price up and pushed the indicator into overbought territory, we must do the opposite and take a short (sell) position. Conversely, if many sell orders caused price to drop and the indicator to move into oversold territory we must begin to take long positions. It’s almost as though they expect price to snap back like a rubber band when it reaches these overextended zones.
Well…what is the proper reaction for casseroles and car engines is not necessarily the right reaction when trading.
When an indicator goes into the Overbought/Oversold areas, remember that it can remain there for quite some time. Just because the RSI or Slow Stochastics indicator reads Overbought for example, does not mean that price action on the pair is like a tightly compressed spring that is going to immediately snap back toward the Oversold area.
Let’s take a look at the Daily chart of the NZDJPY below for an example on this…
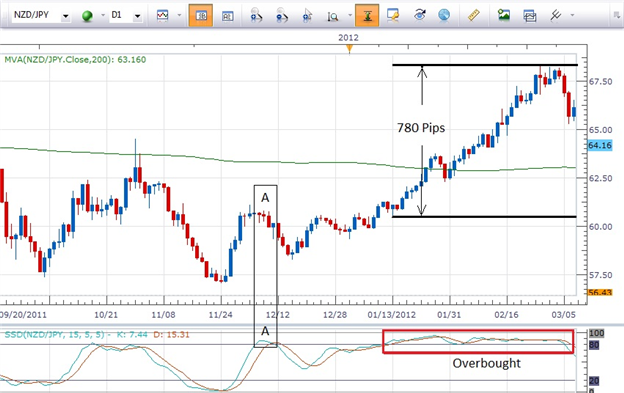
Notice on this chart that the first time Slow Stochastics went above 80 into the Overbought area, price continued to go up for another 780+ pips and Stochastics stayed overbought the entire time. Clearly a trader who went short when it first went into Overbought territory would have missed out on a great move. They also would have gotten stopped out of their short position in fairly short order.
To see an example of where price retreats when Slow Stochastics goes into Overbought territory we need to look no further than the area labeled “A” on the chart. In this case the candlesticks around “A”, dojis, spinning tops, shooting star and a hammer, indicate the potential for a pullback.
The point to be made is that either scenario can play out so don’t have a knee jerk reaction to the Overbought and Oversold areas of an indicator.
Remember…
Only take entry signals from an indicator that is in the direction of the longer term trend.
For example, if the trend has been strong and prolonged to the upside, it stands to reason that the indicator will be in Overbought territory since it reflects the bullish push of price action. To take a short position at that point would be to trade against the trend and that would be introducing more risk into the trade.
=================
This is the video about overbought/oversold levels here.
Great Indicator Scriptor,
However bar count is limited to 1000 , I have tried setting to 0 using source code so it returns for every value on chart but it returns no value on line draw. I want to backtest on 1hr chart for long period. Please could you advise me on what to do as I have tried changing code but does not work.
Thank you for the indicator.
- Free trading apps
- Over 8,000 signals for copying
- Economic news for exploring financial markets
You agree to website policy and terms of use
Schaff Trend Cycle:
Author: John Smith