Amazing Strategy that works.
it may take hours and hours of watching the chart, but keep watching until the high or low for the day has been hit.
Make an alert for this strategy, you can get rich but also sick... we will find you at T.A., that doesn't stand for Technical Analysts but Traders Anonymous! XD (lol)
- The market opens 5pm ET, (EST or EDT whichever is in effect.)
- You can't know when you've hit the HOD/LOD until the next day. You're guessing.
- On average the HOD/LOD is formed during the early London session (~10 GMT/BST) ~5 am ET. You'll be watching that chart for 11 hours. LOL
- The strategy is called the London Open.
Make an alert for this strategy, you can get rich but also sick... we will find you at T.A., that doesn't stand for Technical Analysts but Traders Anonymous! XD (lol)
HAHAHA great comment Jox90, you can get rich but also sick (Watching the chart all day is boring)
HAHAHA great comment Jox90, you can get rich but also sick (Watching the chart all day is boring)
pls this is nice
Hello everyone!
Some years ago I found on another website, a strategy that works good and I added a little something that makes it even better.
Here's the original strategy and then my little addon...
<strategy>
You make 1 trade per day on the EURUSD
Your "day" ends at 4:59EST and starts at 5pm EST
Use 60 minute chart with the MACD and RSI on the chart
Each day at 5pm EST you start watching the chart. it may take hours and hours of watching the chart, but keep watching until the high or low for the day has been hit.
As soon as the daily high or low has been hit on the 60 minute charts, switch to your 1 minute charts. if the daily high or low has also been hit on the 1 minute chart, the signal is confirmed.
After the signal is confirmed enter the trade immediately. if it is the high for the day that has been hit, go short. if it is the daily low that has been hit, go long.
Set stop loss of 15 pips and a profit target of 25 pips.
</strategy>
To make sure you know when the hi or low of the day arrises, here's my trick.
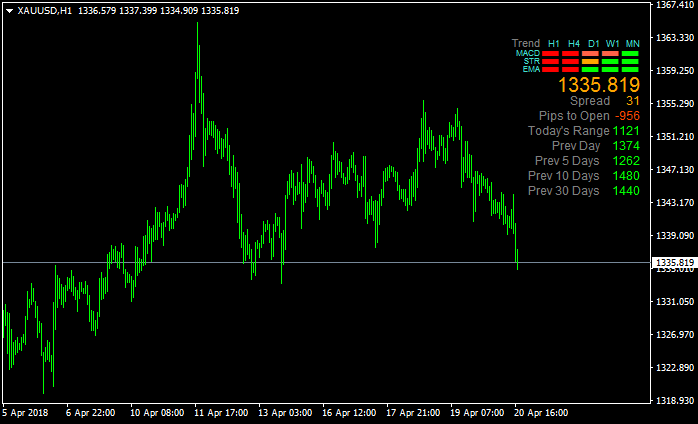
I suggest a small indicator to help that strategy that works real good...
It is attached here and what it does it that it shows the number of pips so far from opening of asian session and gives you the average for the last 5, 10 and 30 days so you check where you stand. I use it with this strategy and it works nearly 100% of the time.
You can also use stop or limit order at the price of daily peak average...
Thanks
- Free trading apps
- Over 8,000 signals for copying
- Economic news for exploring financial markets
You agree to website policy and terms of use
Hello everyone!
Some years ago I found on another website, a strategy that works good and I added a little something that makes it even better.
Here's the original strategy and then my little addon...
<strategy>
You make 1 trade per day on the EURUSD
Your "day" ends at 4:59EST and starts at 5pm EST
Use 60 minute chart with the MACD and RSI on the chart
Each day at 5pm EST you start watching the chart. it may take hours and hours of watching the chart, but keep watching until the high or low for the day has been hit.
As soon as the daily high or low has been hit on the 60 minute charts, switch to your 1 minute charts. if the daily high or low has also been hit on the 1 minute chart, the signal is confirmed.
After the signal is confirmed enter the trade immediately. if it is the high for the day that has been hit, go short. if it is the daily low that has been hit, go long.
Set stop loss of 15 pips and a profit target of 25 pips.
</strategy>
To make sure you know when the hi or low of the day arrises, here's my trick.
I suggest a small indicator to help that strategy that works real good...
It is attached here and what it does it that it shows the number of pips so far from opening of asian session and gives you the average for the last 5, 10 and 30 days so you check where you stand. I use it with this strategy and it works nearly 100% of the time.
You can also use stop or limit order at the price of daily peak average...
Thanks