Something Interesting to Read May 2014
Chan: Algorithmic Trading: Winning Strategies and Their Rationale (Wiley Trading)
Engaging and informative, Algorithmic Trading skillfully covers a wide
array of strategies. Broadly divided into the mean-reverting and
momentum camps, it lays out standard techniques for trading each
category of strategies and, equally important, the fundamental reasons
why a strategy should work. The emphasis throughout is on simple and
linear strategies, as an antidote to the over-fitting and data-snooping
biases that often plague complex strategies. Along the way, it provides
comprehensive coverage of:
- Choosing the right automated execution platform as well as a backtesting platform that will allow you to reduce or eliminate common pitfalls associated with algorithmic trading strategies
- Multiple statistical techniques for detecting "time series" mean reversion or stationarity, and for detecting cointegration of a portfolio of instruments
- Simple techniques for trading mean-reverting portfolios—linear, Bollinger band, and Kalman filter—and whether using raw prices, log prices, or ratios make the most sense as inputs to these tests and strategies
- Mean-reverting strategies for stocks, ETFs, currencies, and futures calendar and intermarket spreads
- The four main drivers of momentum in stocks and futures, and strategies that can extract time series and cross sectional momentum
- Newer momentum strategies based on news events and sentiment, leveraged ETFs, order flow, and high-frequency trading
- Issues involving risk and money management based on the Kelly formula, but tempered with the author's practical experience in risk management involving black swans, Constant Proportion Portfolio Insurance, and stop losses
- Mathematics and software are the twin languages of algorithmic trading. This book stays true to that view by using a level of mathematics that allows for a more precise discussion of the concepts involved in financial markets. And it includes illustrative examples that are built around MATLAB© codes, which are available for download.
The Complete Guide To Point & Figure Charting : The New Science of an Old Art
The aim of this book is to explain point-and-figure charting to European
investors and traders, and to show why it is the most reliable
technical tool for timing entry and exit points in stocks, indices and
other securities.
The book is written for all levels of trader, from the
novice to the experienced. It starts by explaining the basics of
point-and-figure, and by showing its advantages over other types of
chart. Readers are then given step-by-step instructions on how to start a
point-and-figure chart from simple price data, and how to add to it
day-by-day using simple rules based on end of day highs and lows.
The
emphasis is on simplicity and clarity. The section on chart
interpretation introduces the basic buy and sell signals, and goes on to
explain the more complex signals, in each case illustrating the
pattern, and the precise entry and exit points, with colour charts from
FTSE stocks and indices. It also shows how trend lines are incorporated
into a chart. The latest point-and-figure trading techniques are covered
in depth.
The authors show how to: use horizontal and vertical counts
to estimate the size of price moves, use stop-orders to protect
positions, use pyramiding to maximise profitable trends, and use swing
trading in combination with p&f. They also show how to adapt your
trading style to the amount of capital you have available and to your
risk tolerance. In the later sections of the book, the authors
concentrate on optimisation of p&f trading and the avoidance of the
most common trap - 'over-fitting' - and on analysis of the profitability
of p&f trading. They demonstrate conclusively that point and
figure, correctly applied, produces consistent and reliable profits
across a variety of markets. In summary, Heinrich Weber & Kermit
Zieg's book is the definitive guide to the theory and application of
point-and-figure charting. It is especially welcome for UK and European
traders, since it uses recent charts of FTSE and European securities as
examples, and includes hitherto unpublished research on p&f's
applicability to European securities.
Forum on trading, automated trading systems and testing trading strategies
Something Interesting to Read April 2014
newdigital, 2014.04.14 20:48
Theory Of Stochastic Processes : With Applications to Financial Mathematics and Risk Theory
This book is a collection of exercises covering all the main topics in
the modern theory of stochastic processes and its applications,
including finance, actuarial mathematics, queuing theory, and risk
theory.
The aim of this book is to provide the reader with the theoretical and
practical material necessary for deeper understanding of the main topics
in the theory of stochastic processes and its related fields.
The book is divided into chapters according to the various topics. Each
chapter contains problems, hints, solutions, as well as a self-contained
theoretical part which gives all the necessary material for solving the
problems. References to the literature are also given.
The exercises have various levels of complexity and vary from simple
ones, useful for students studying basic notions and technique, to very
advanced ones that reveal some important theoretical facts and
constructions.
This book is one of the largest collections of problems in the theory of
stochastic processes and its applications. The problems in this book
can be useful for undergraduate and graduate students, as well as for
specialists in the theory of stochastic processes.
Forum on trading, automated trading systems and testing trading strategies
Indicators: Stochastic Oscillator Blau_TS_Stochastic
newdigital, 2014.01.22 12:58
How to Trade with Stochastic Oscillator (based on dailyfx.com article)
- Slow Stochastic provides clear signals in a forex strategy
- Take only those signals from overbought or oversold levels
- Filter forex signals so you are taking only those in the direction of the trend
Stochastic is a simple momentum oscillator developed by George C. Lane
in the late 1950’s. Being a momentum oscillator, Stochastic can help
determine when a currency pair is overbought or oversold. Since the
oscillator is over 50 years old, it has stood the test of time, which is
a large reason why many traders use it to this day.
Though there are multiple variations of Stochastic, today we’ll focus solely on Slow Stochastic.
Slow stochastic is found at the bottom of your chart and is made up of
two moving averages. These moving averages are bound between 0 and 100.
The blue line is the %K line and the red line is the %D line. Since %D
is a moving average of %K, the red line will also lag or trail the blue
line.
Traders are constantly looking for ways to catch new trends that are developing. Therefore, momentum oscillators can provide clues when the market’s momentum is slowing down, which often precedes a shift in trend. As a result, a trader using stochastic can see these shifts in trend on their chart.
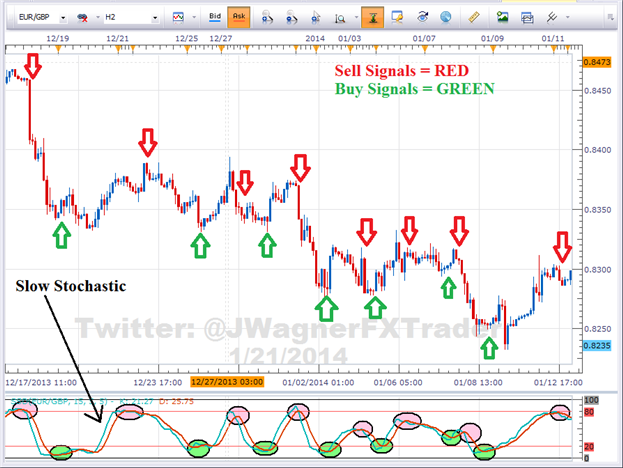
Momentum shifts directions when these two Stochastic lines cross.
Therefore, a trader takes a signal in the direction of the cross when
the blue line crosses the red line.
As you can see from the picture above, the short term trends were
detected by Stochastic. However, traders are always looking for ways to
improve signals so they can be strengthened. There are two ways we can
filter these trades to improve the strength of signal.
1 - Look for Crossovers at Extreme Levels
Naturally, a trader won’t want to take every signal that appears. Some signals are stronger than others. The first filter we can apply to the oscillator is taking cross overs that occur at extreme levels.
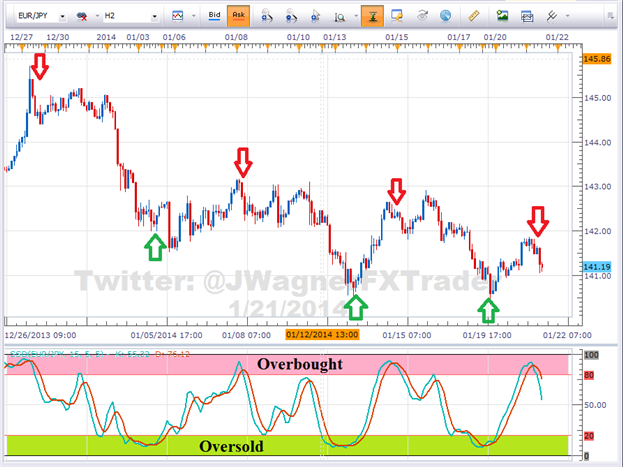
Since the oscillator is bound between 0 and 100, overbought is
considered above the 80 level. On the other hand, oversold is considered
below the 20 level. Therefore, cross downs that occur above 80 would
indicate a potential shifting trend lower from overbought levels.
Likewise, a cross up that occurs below 20 would indicate a potential shifting trend higher from oversold levels.
2 - Filter Trades on Higher Time Frame in Trend’s Direction
The second filter we can look to add is a trend filter. If we find a
very strong uptrend, the Stochastic oscillator is likely to remain in
overbought levels for an extended period of time giving many false sell
signals.
We would not want to sell a strong uptrend since more pips are available in the direction of the trend.
Therefore, if we find a strong uptrend, we need to look for a dip or
correction to time a buy entry. That means waiting for an intraday chart
to correct and show oversold readings.
At that point, if Stochastic crosses up from oversold levels, then the
selling pressure and momentum is likely alleviated. This provides us a
signal to buy which is in alignment with the larger trend.
Forum on trading, automated trading systems and testing trading strategies
Indicators: Stochastic Oscillator
newdigital, 2013.10.09 07:23
Pinpointing Forex Trend Trade Entries with Stochastics
- An uptrend is made up of higher highs and higher lows. Traders can use Stochastics to find excellent risk to reward entries at those low support points in the trend.
- A downtrend is made up of lower highs and lower lows. Forex traders can use Stochastics to find excellent risk to reward entries at these resistance high points
- Stochastics can be used to alert a forex trader to either tighten stops, reduce the position size, or take profit once in a trend trade
By far, traders who trade in the direction of the predominant daily trend have a higher percentage of success than those who trade the counter trend. One of the biggest attractions of the Forex market it is characterized by long trends that afford traders the potential to make hundreds of pips if they have timed their entries with precision and used protective stops to limit risk.
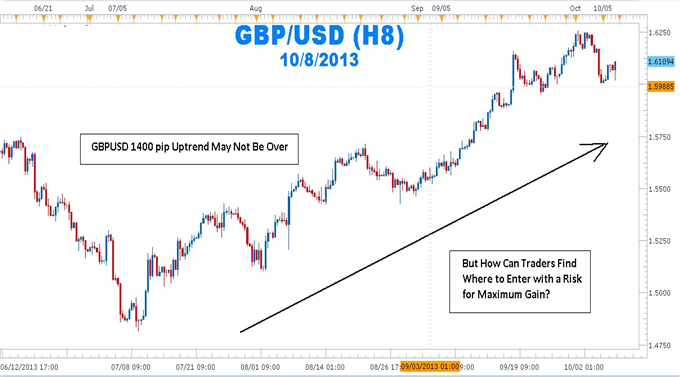
But How Can Traders Find Where to Enter with a Risk for Maximum Gain?
The mantra, “the trend is your friend until it ends,” can be found in
many trading books, but it seems that many forex traders have not made
the trend their friend and in some cases, the trend has become the
enemy. Rather than being on the receiving end of those pips afforded to
traders who have correctly entered the trend, many traders have been on
the “giving” end of the trade losing pips while fighting the trend.
As people have turned to online dating services to meet their ideal
match, forex traders can turn to stochastics as a way of making the
trend the their friend again.
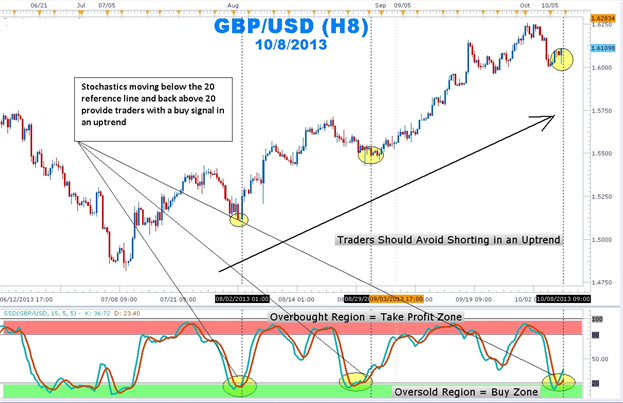
In an uptrend on a daily chart, stochastics %K and %D lines moving below
the horizontal ‘20’ reference line and coming back above the 20 line
indicates that the profit-taking correction is coming to an end. The
stochastic crossing up also tells us that buyers are beginning to enter
the market again. In addition, this shows that there is good support.
How to Trade the Trend Using Stochastics
Patience is the name of the game when attempting to trade with the
trend. Getting into the trend too early can expose traders to large
drawdowns. Getting in too late reduces the amount of profit before the
swing is completed.
Use the stochastics indicator to find that “Goldilocks” entry of not too early and not too late. Once a strong uptrend is found, wait for stochastics with the settings of 15, 5, 5 to move into the oversold region below the 20 horizontal reference line. Next, wait for the %K and %D lines to move back above the 20 line. Enter long with a stop placed a few pips below the last low. Set a limit for at least twice the size of the stop.
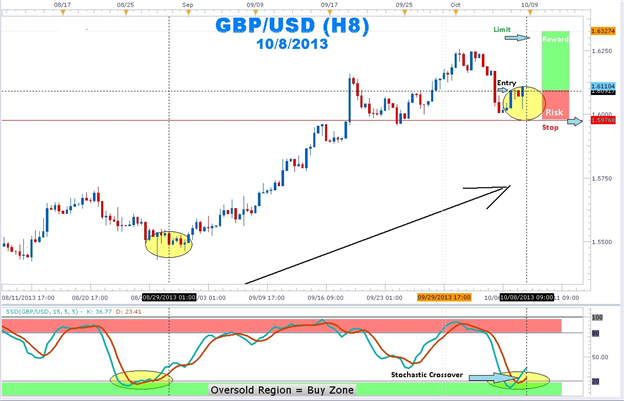
Once in an uptrend position, traders will attempt to squeeze as much
profit as possible. Traders usually take profits on their open position
or trail stops once stochastics moves into the overbought region. It is
important to note that a forex currency pair can continue to make new
highs even though stochastics is in the overbought region.
So next time you see a trend and you do not know how to make it your
“friend”, let the stochastics indicator introduce you! Once these swings
are highlighted by stochastics, stop placement becomes easier as well.
stochastics crossovers in an uptrend can help you pinpoint your entries
to join the major trend.
by Thomas Bulkowski
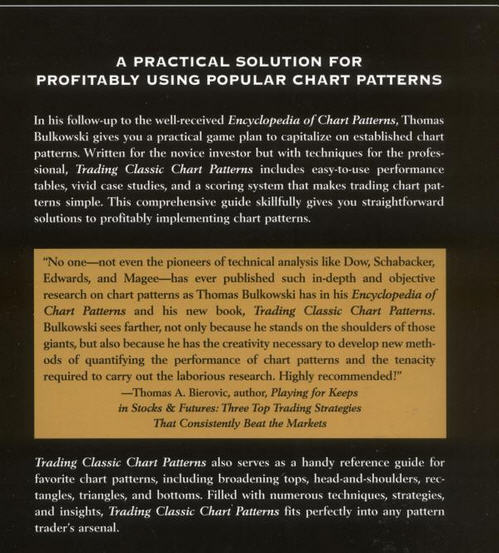
Use popular chart patterns profitably
In his follow-up to the well-received Encyclopedia of Chart Patterns,
Thomas Bulkowski gives traders a practical game plan to capitalize on
established chart patterns. Written for the novice investor but with
techniques for the professional, Trading Classic Chart Patterns includes
easy-to-use performance tables, vivid case studies, and a scoring
system that makes trading chart patterns simple. This comprehensive
guide skillfully gives investors straightforward solutions to profitably
trading chart patterns. Trading Classic Chart Patterns also serves as a
handy reference guide for favorite chart patterns, including broadening
tops, head-and-shoulders, rectangles, triangles, and double and triple
bottoms. Filled with numerous techniques, strategies, and insights,
Trading Classic Chart Patterns fits perfectly into any pattern trader's
arsenal.
Thomas N. Bulkowski (Keller, TX), an active investor since 1981, is the
author of the highly acclaimed Encyclopedia of Chart Patterns as well as
numerous articles for Technical Analysis of Stocks & Commodities.
Trained as a computer engineer, Bulkowski worked for over a decade at
Tandy Corporation. Prior to that, he worked on the Patriot air defense
system for Raytheon.
New technology and the advent of around the clock trading have opened
the floodgates to both foreign and domestic markets. Traders need the
wisdom of industry veterans and the vision of innovators in today's
volatile financial marketplace. The Wiley Trading series features books
by traders who have survived the market's ever changing temperament and
have prospered-some by reinventing systems, others by getting back to
basics. Whether a novice trader, professional or somewhere in-between,
these books will provide the advice and strategies needed to prosper
today and well into the future.
Market Sense & Nonsense ~ Jack D. Schwager
When it comes to the markets, academics, professionals and novice
investors have one thing in common: They all operate on assumptions that
fail to hold up in the harsh light of reality. The following are a
sampling of observations about how markets really work:
- The market is not always right. The best opportunities arise when the market is most wrong.
- Big price moves begin on fundamentals but end on emotion.
- Past returns are not future returns. Past returns can be very misleading if there are reasons to believe that future market conditions are likely to be significantly different from those that shaped past returns.
- The best-performing past investments often do worse than the worst-performing past investments in the future--and the future after all is where we all have to make our investment decisions.
- The best time to initiate long-term investments in equities is after extended periods of underperformance.
- Faulty risk measurement is worse than no risk measurement at all because it will lull investors into unwarranted complacency.
- Volatility is frequently a poor proxy for risk. Many low volatility investments have high risk, while some high volatility investments have well-controlled risk.
- The real risks are often invisible in the track record.
- High past returns sometimes reflect excessive risk-taking in a favorable market environment rather than manager skill.
- Return alone is a meaningless statistic because return can always be increased by increasing risk. Return/risk should be the primary performance metric.
- Leverage alone tells you nothing about risk. Risk is a function of both the underlying portfolio and leverage. Leveraged portfolios can often be lower risk than unleveraged portfolios--it depends on the assets in the portfolio.
 eBook: Jack D. Schwager, Joel Greenblatt: Kindle Store")
- reviews: 26
- 26.99 USD
- Jack D. Schwager
- www.amazon.com
- Free trading apps
- Over 8,000 signals for copying
- Economic news for exploring financial markets
You agree to website policy and terms of use
This is the thread about books related for stocks, forex, financial market and economics. Please make a post about books with possible cover image, short description and official link to buy (amazon for example).
Posts without books' presentation, without official link to buy and with refferal links will be deleted.Posts with links to unofficial resellers will be deleted