LRA - the New and Final Analysis of the Futures Markets?
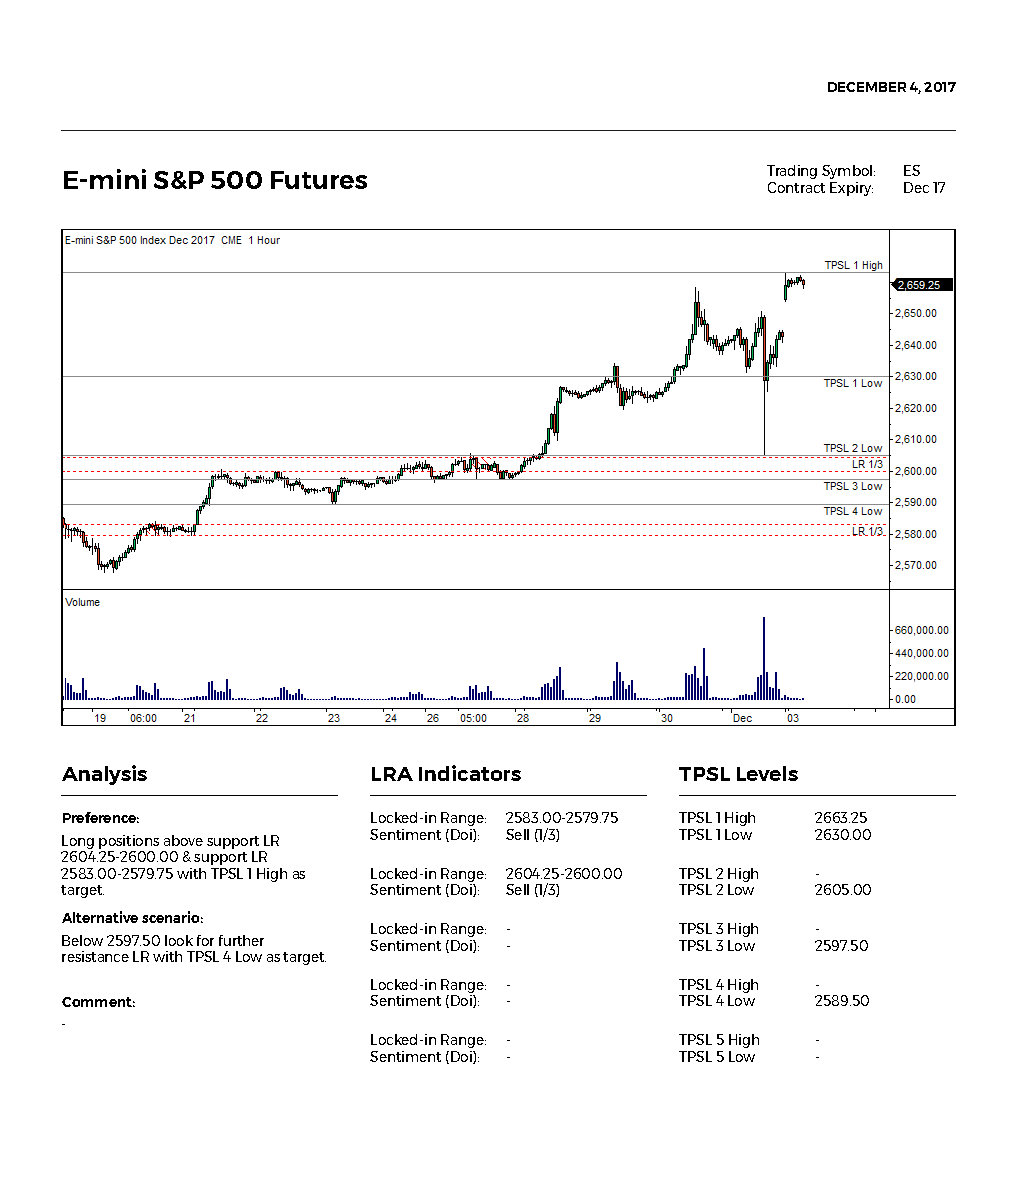
E-mini S&P 500 Futures
December 2017, 1 Hour
Period: 15 October – 27 October

Locked-in Range: 2562.75-2556.75; Sentiment (Doi): Sell (1/3)
Preference: Long positions above support LR 2562.75-2556.75
Comment: The breakout of High extremum of LR (TPSL 1 High) and previous swing High (TPSL 2 High), the end of next trading day without price return to LR are indicators pointing to the volume imbalance of prevailing “Sell” open positions until the price goes out of LR. There is a probability of having the remaining “Sell” open positions in the range.

Comment: In the moment of price approximation to LR, the volume of the remaining “Sell” open positions had a sufficient influence on the price formation when it is profitable for the market-making system to quote prices below the range.
What is Doi?
Doi - Degree of Imbalance
It depends on:
- Number of open positions
- Volume’s appearance beyond TPSL levels2
- Support/resistance zone at first return3
What is Locked-in Range?
Locked-in Range (abbr. LR) is the trading range in which the volume of open positions accumulates, making the price change to the side where the prevailing volume of open positions will be locked at a loss, because the price will no longer allow to close in profits or break-even.

Resistance LR is the locked-in range in which the volume of open buy positions prevails, and it is profitable for the market maker to quote prices below the range.

Support LR is the locked-in range in which the volume of open sell positions prevails, and it is profitable for the market maker to quote prices above the range.

Open positions, their take-profits and stop-losses are the only true source of information for making decisions on speculative entry into the futures market with the market maker, therefore, those who do not base their trading decisions on it are Lucky-traders.
What is TPSL level?
Take Profit Stop Loss level (abbr. TPSL level) is the price level at which sellers and buyers will exit the market, closing their open positions by take-profits and stop-losses.
There is no sense in trying to forecast the prevailing open positions in the locked-in range; it is necessary to analyze the price and volume changes after the range breakout and in proximity to the TPSL levels, which will allow to join the further profitable price changes for the market maker.
The logic of price changes in the futures markets, where liquidity is provided by market makers.
Lets see how Locked-in Range Analysis looks like:
Example: E-mini S&P 500 Period: December 2017

LRA gives an answer for why market participants face situations when the price unfolds “point-to-point” immediately after the execution of their pre-set stop-loss, or the price unfolds before reaching their pre-set take-profit 1 tick.
LRA Examples:
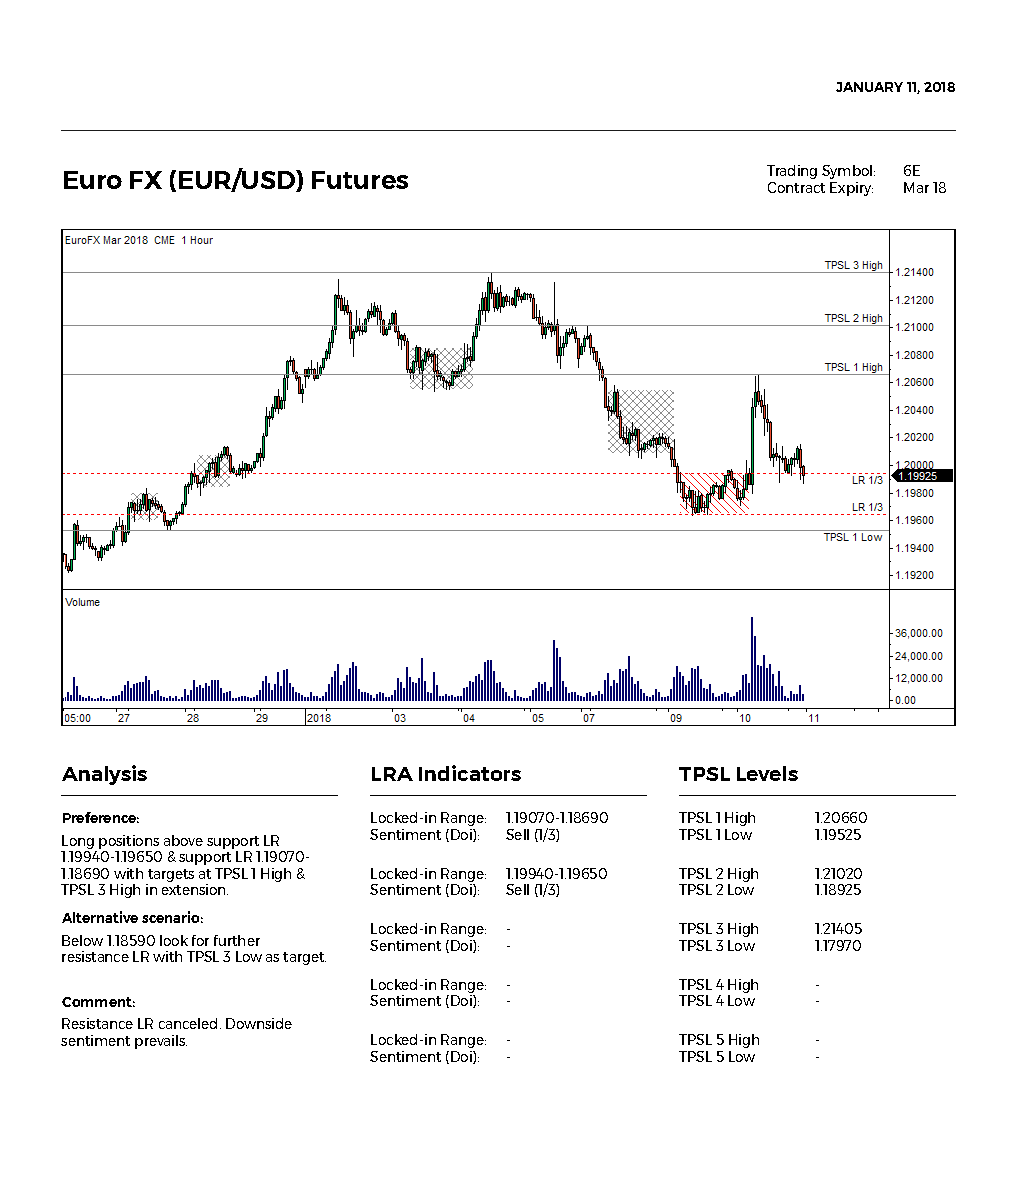
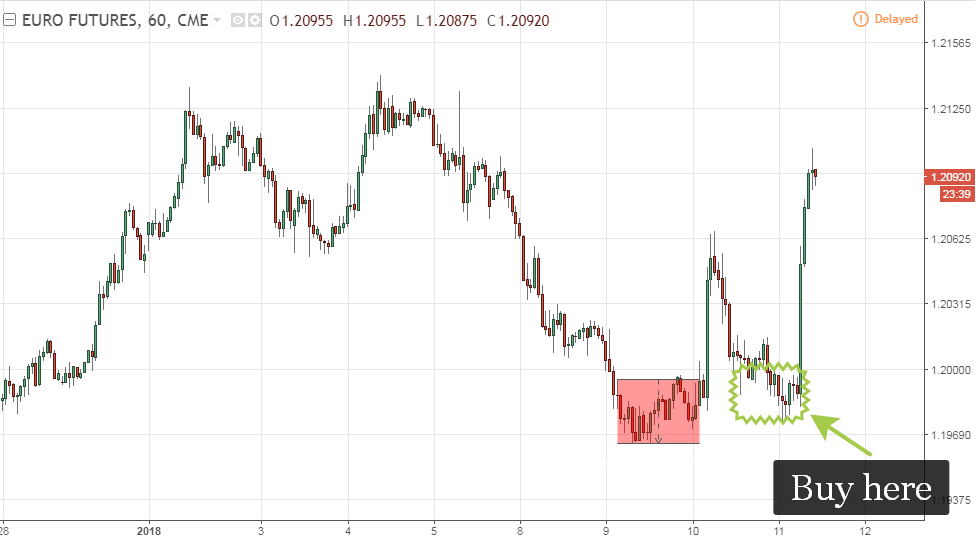
EUR/USD

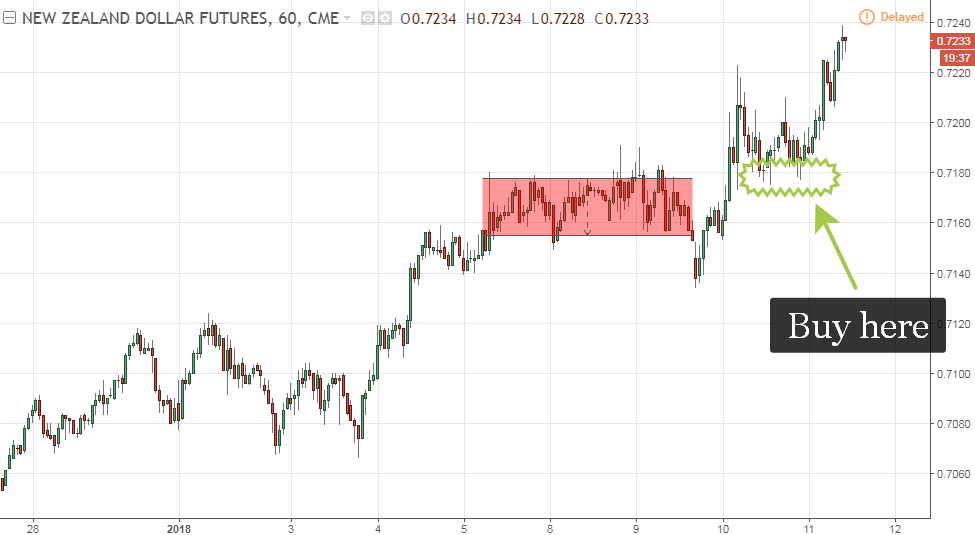
NZD/USD

Who Are Market Makers? (Definition by CME Group)
A market maker (one type of speculator) is an authorized customer permissioned to quote both the buy and sell side in a given market (while all other market participants may open positions only in one direction – unidirectional). The main function of the market maker is to provide liquidity to the marketplace (сontractual agreement with CME), usually in exchange for a reduction in trading fees. Market makers often profit from capturing the spread, the small difference between the bid and offer prices over a large number of transactions.
Modern futures market cannot function without such a professional participant as a market maker, since 24-hour trades include illiquid periods when there are sharp imbalances in supply and demand, and if the market is allowed to determine prices independently in such periods, then we can observe increased volatility and price manipulation, which can be very significant and would be regarded by market participants as an increased trade risk, equivalent to an illiquid instrument; therefore, the stock exchange, in our case its CME Group, is interested in the presence of market makers, providing them with privileges in exchange for compliance with the established obligations to provide and maintain liquidity.
Responsibilities of Market Makers
During the specified period of the trading session (American, Asian-Pacific, European), the market makers must continuously maintain two-way futures quotes, observing the minimum volume of own orders agreed with the exchange and the spread between bid-ask quotes (widening of spread for periods of increased volatility is possible).
As counterparties to each transaction in terms of pricing, market makers must take the opposite side of your trade. In other words, whenever you sell, they must buy from you, and vice versa.
IMPORTANT. Why do market makers act as counterparties for most orders, but not for all? The rest of the transactions may temporarily be accumulated by other market participants, both with speculators and hedgers; however, over time, all open positions will pass on to market makers, when one of the parties of a transaction, in which the market maker does not participate, decides to close the position.
Capabilities of Market Makers
To understand the capabilities of market makers, one should know the limited market depth available to any participant: 1) Data featuring the nearest (best) placed 10 bid and 10 ask limit orders shows the price and number of contracts (Level 2). 2) Data featuring each transaction made shows the price, time, and number of contracts (Time & Sales).
CME Group market makers use the full market depth available to the exchange, namely:
- Data featuring all existing placed limited orders.
- Data featuring all existing placed stop orders.
- Data featuring all open positions: price, volume, and side of order (buy/sell).
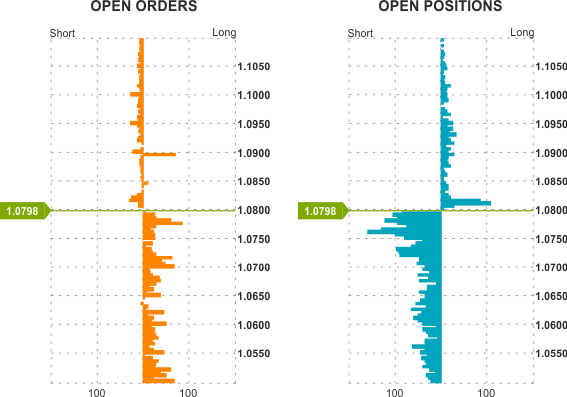
Figure 1. Net Positions (buy+sell) Marketmaker Order Book (Open orders, Open positions)
Market makers collectively create a market for each futures, centrally managing its common pool of positions to prevent conflicts of interest that would arise when working separately, when instead of earning the spread and self-quoting, market makers would get a large volume of positions that would not have a counterparty to close before the expiration of the futures.
What is Market-Making? (Definition by Tom Leksey)
Market-making (CME Group) is a centralized automated trading system of placing orders from market participants, which has a common pool of Commercial and Non-commercial accounts, which provides liquidity in the futures market, simultaneously opening new positions (buy/sell) and closing already accumulated positions, so that the shares of profit are distributed between each participant in accordance with the established proportions.
Only market makers know the current open positions (volume, side of order) and we can only forecast but this is enough to make money in the market using Locked-in Ranges, Degree of imbalance, TPSL Levels.
Best Locked-in Ranges of the Month (January 2018)
Japanese Yen (JPY/USD) Futures
Reason for opening Buy position:
An approximation of price to the support Locked-in Range

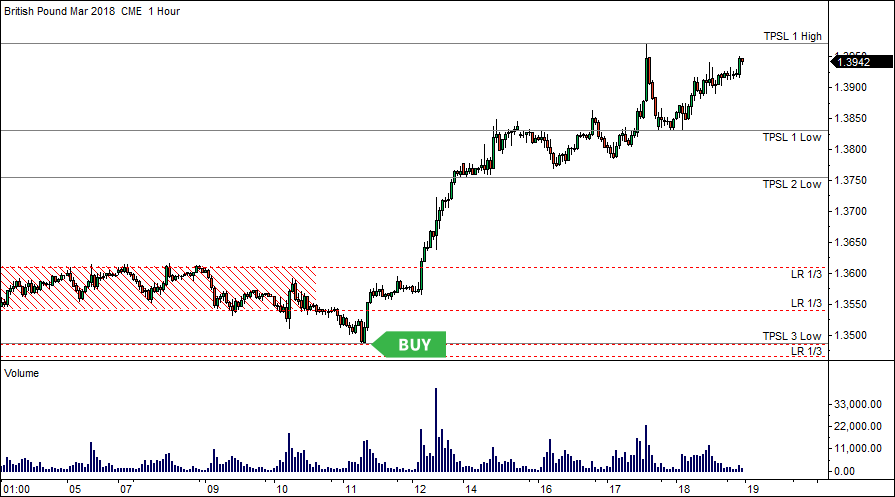
British Pound (GBP/USD) Futures
Reason for opening Buy position:
An approximation of price to the support Locked-in Range
Australian Dollar (AUD/USD) Futures
Reason for opening Buy position:
An approximation of price to the support Locked-in Range

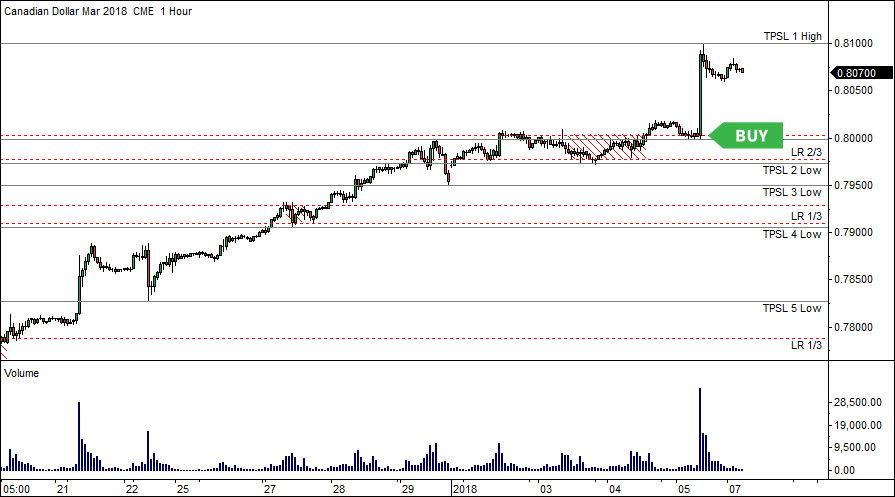
Canadian Dollar (CAD/USD) Futures
Reason for opening Buy position:
An approximation of price to the support Locked-in Range
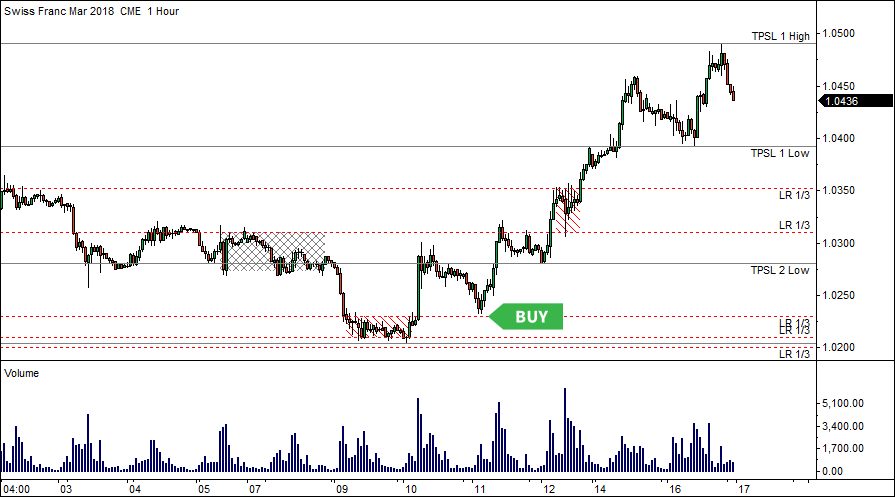
Swiss Franc (CHF/USD) Futures
Reason for opening Buy position:
An approximation of price to the support Locked-in Range
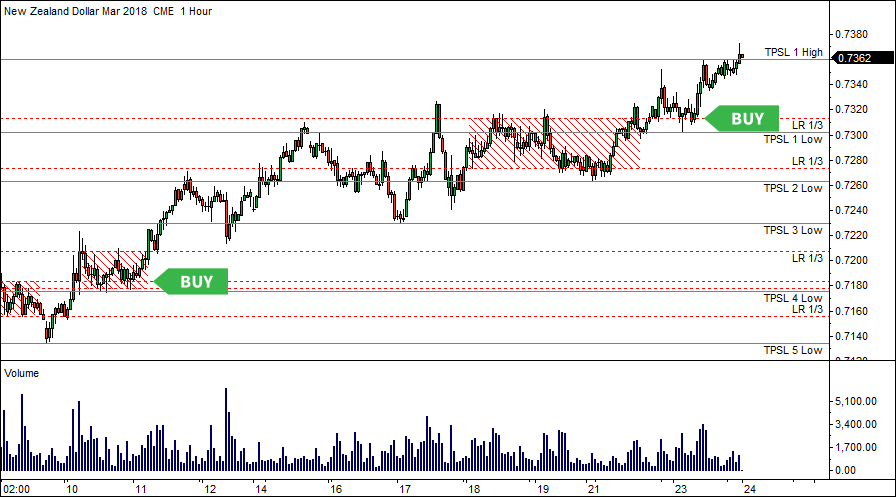
New Zealand Dollar (NZD/USD) Futures
Reason for opening Buy position:
An approximation of price to the support Locked-in Range
How to Determine and Use Locked-in Ranges. Step by Step
Locked-in Range (abbr. LR) is the trading range in which the volume of open positions accumulates, making the price change to the side where the prevailing volume of open positions will be locked at a loss, because the price will no longer allow to close in profits or break-even.
STEP 1. Determining the prices and time of a LRFinding the high traded volume range within TPSL 1 Levels which means a high possibility of accumulated open positions with not intraday interest.
STEP 2. Waiting for a TPSL 1 Level BreakoutTake Profit Stop Loss level (abbr. TPSL level) is the price level at which sellers and buyers will exit the market, closing their open positions by take-profits and stop-losses.
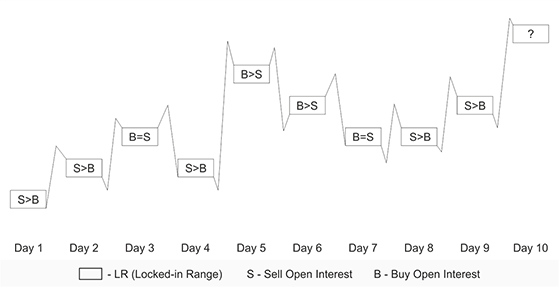
STEP 3. Determining the direction and degree of open positions’ imbalance of a LRLRA Basis: It is not profitable for a market maker to return the price into the LR with high volume of unidirectional open positions, so that loss-making positions cannot close at break-even levels.
Without knowing the direction and volume of open positions within a LR and the direction and volume of closed positions after the breakout of TPSL level, it is only possible to focus on the average scenario of volume’s appearance and the time spent out of the LR.
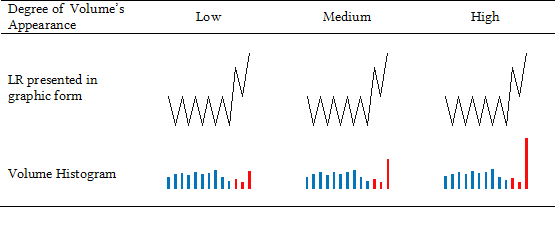
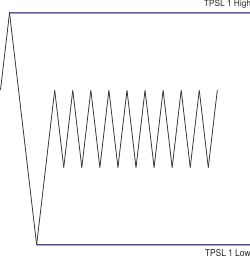
Figure. Average scenario for determining the volume’s appearance
STEP 4. Confirming or Changing the direction and degree of open positions’ imbalanceConfirming of LR is a price out-range quotation for the next trading day (after TPSL 1 Level Breakout) without the price's return to the LR.
We can assume a False Breakout only with Low Degree of Volume's Appearance and price out-range quotation must be shorter in time than in the considered range. In cases of Medium and High Volume Appearance, a price return means an insufficient imbalance of open positions of the range and that is LR cancellation.
- Free trading apps
- Over 8,000 signals for copying
- Economic news for exploring financial markets
You agree to website policy and terms of use
LRA is the method of interpreting the price and volume chart to determine the direction of the prevailing volume of open positions, the imbalance of which will enlighten you to future market behavior.
LRA is a cause-and-effect analysis method arising from the basis of the market, therefore, by applying LRA, you will either become one of the professional market participants getting a non-random and repeatable result or you will consciously leave trading for good.
Lets talk about this method.