Indicators: Bollinger Bands ®
Hello, does anyone know how the Bollinger Bands level lines are calculated in Metatrader, please?
I need these values to use in an EA but I don't know how to get to them.
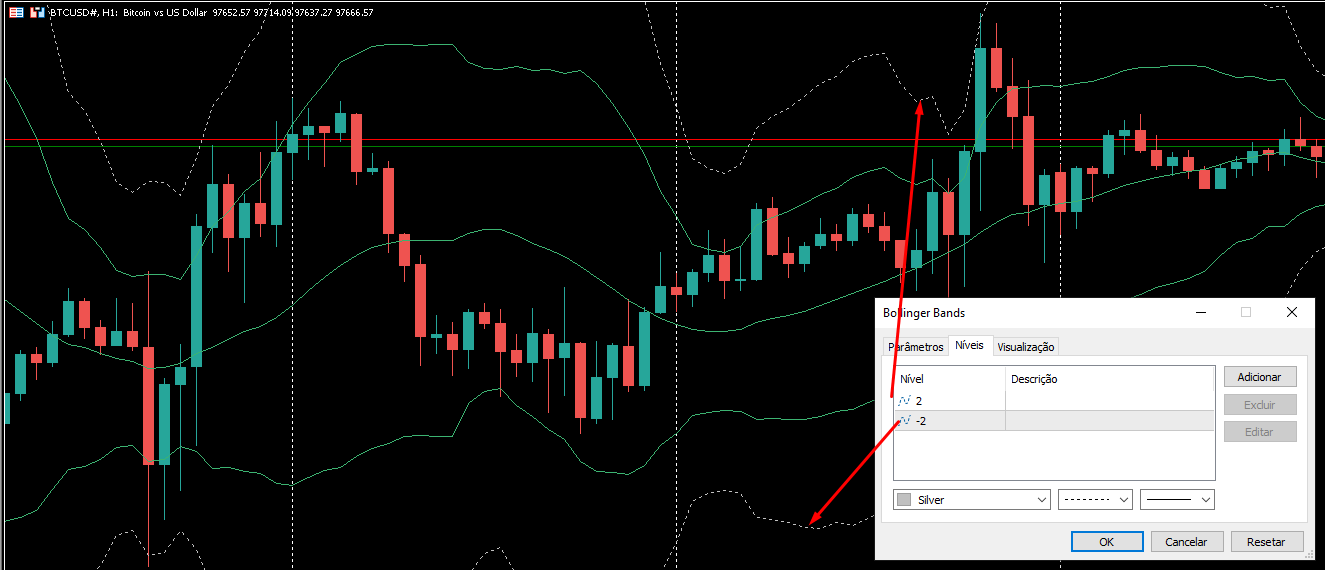
The print below is of a standard configuration. Period 20, Offsets 2, Offset 0 applied to closing price.
And the levels I put +2 (upper white line) and -2 (lower white line).
@Rodolfo Andrade #: how are the Bollinger Bands level lines calculated in Metatrader, please?
"Bollinger Bands are nothing more than a simple moving average(SMA) with the bands calculated from thestandard deviation multiplied by the ratio (usually ±2.0).
In other words...
The extra levels are calculated in the same way.SMA ± StdDev * Rácio

Bollinger Bands - Indicadores de tendência - Uso de indicadores técnicos - Gráficos, análise técnica e fundamental - Ajuda para o MetaTrader 5
- www.metatrader5.com
O Indicador Técnico Bollinger Bands (BB) é semelhante ao Envelopes. A diferença entre eles consiste no fato de as fronteiras...
You are missing trading opportunities:
- Free trading apps
- Over 8,000 signals for copying
- Economic news for exploring financial markets
Registration
Log in
You agree to website policy and terms of use
If you do not have an account, please register
Bollinger Bands ®:
Bollinger Bands ® technical indicator (BB) is similar to Envelopes. The only difference is that the bands of Envelopes are plotted a fixed distance (%) away from the moving average, while the Bollinger Bands are plotted a certain number of standard deviations away from it. Standard deviation is a measure of volatility, therefore Bollinger Bands adjust themselves to the market conditions. When the markets become more volatile, the bands widen and they contract during less volatile periods.
The following traits are particular to the Bollinger Band:
The last observation is useful for forecasting price guideposts.
Author: MetaQuotes Software Corp.
Bollinger Band indicator