Something Interesting to Read March 2014 - page 2
You are missing trading opportunities:
- Free trading apps
- Over 8,000 signals for copying
- Economic news for exploring financial markets
Registration
Log in
You agree to website policy and terms of use
If you do not have an account, please register
Market Risk Analysis, Pricing, Hedging, Trading Financial Instruments (Volume III) : Professor Carol Alexander
Written by leading market risk academic, Professor Carol Alexander, Pricing, Hedging and Trading Financial Instruments forms part three of the Market Risk Analysis four volume set. This book is an in-depth, practical and accessible guide to the models that are used for pricing and the strategies that are used for hedging financial instruments, and to the markets in which they trade. It provides a comprehensive, rigorous and accessible introduction to bonds, swaps, futures and forwards and options, including variance swaps, volatility indices and their futures and options, to stochastic volatility models and to modelling the implied and local volatility surfaces.
All together, the Market Risk Analysis four volume set illustrates virtually every concept or formula with a practical, numerical example or a longer, empirical case study. Across all four volumes there are approximately 300 numerical and empirical examples, 400 graphs and figures and 30 case studies many of which are contained in interactive Excel spreadsheets available from the the accompanying CD-ROM . Empirical examples and case studies specific to this volume include:
by Thomas N. Bulkowski
In this revised and expanded second edition of the bestselling Encyclopedia of Chart Patterns, Thomas Bulkowski updates the classic with new performance statistics for both bull and bear markets and 23 new patterns, including a second section devoted to ten event patterns. Bulkowski tells you how to trade the significant events -- such as quarterly earnings announcements, retail sales, stock upgrades and downgrades -- that shape today?s trading and uses statistics to back up his approach. This comprehensive new edition is a must-have reference if you're a technical investor or trader. Place your order today.
"The most complete reference to chart patterns available. It goes where no one has gone before. Bulkowski gives hard data on how good and bad the patterns are. A must-read for anyone that's ever looked at a chart and wondered what was happening."
Forum on trading, automated trading systems and testing trading strategies
Press review
newdigital, 2014.03.29 08:51
How to Trade a Triangle (based on dailyfx article)- GBPJPY broke out of a 967 pip symmetrical triangle that had a target over 180.00
- The advance from the breakout point of 171.13 was halted at 173.56 and price turned down
- A new triangle can be drawn taking into account the new swing points created by the false breakout
Forex symmetrical triangles are important price patterns relied on by traders to identify periods of consolidation ahead of an anticipated large breakout. Traders like using triangle price patterns because they have risk to reward parameters which are easy to determine from the pattern itself.Not only can the stop be placed just outside the pattern, but a limit can be determined by measuring the height of the pattern and projecting this distance in pips from the breakout point. This is called a measurement objective.
Thomas Bulkowski in his book, Encyclopedia of Chart Patterns stated that symmetrical triangles meet their upside targets 66% of the time. However, the recent GBPJPY triangle that was posted in my March 4th 2014 article was part of the 33% of triangle breakout failures.
Learn Forex – GBPJPY Symmetrical Triangle False Breakout
As you can see in the chart above of the GBPJPY symmetrical triangle, a breakout happened at 171.13. Initially, wide ranging candlesticks breaking above the top of the symmetrical triangle may have led traders to believe the up move had more to go. However, the doji candlestick pattern was joined by a bearish candlestick forming a Japanese candlestick evening star pattern at 173.56 capped this rally.
From this point, we can see an acceleration in bearish price action as a series or red candlesticks form Bullish breakout traders are now caught in what is called a “bull trap” in the 167.60 area. Stops are triggered and longs are shaken out. Today, we see a strong surge in yen weakness and GBPJPY rebounds. The question now is, “Should traders give GBPJPY another chance?”
Learn Forex – GBPJPY Daily Chart Revised Symmetrical Triangle
A New Triangle Emerges
If the fundamental and technical reasons that existed when the trade was made still exist after a stop out, then we would consider re-entering the trade. However, forex triangle traders may make modifications to the initial triangle in order to take into account the new swing highs and swing lows.
First of all, the new swing high which was created by the false breakout is connected to a higher previous high. Next, the new swing low which was created by breakout below support is connected by an upward sloping trend line from the previous swing low. The result is a new symmetrical triangle with new buy and sell parameters. New limits are set as well.
How to Trade this New Triangle
The breakout method for trading a symmetrical triangle has not changed. However, the triangle has become bigger. Despite the big GBPJPY big 350-pip run-up today to 171.05, GBPJPY is another 250 pips from making a confirmed triangle breakout. Triangle resistance is at 172.70 area making a long GBPJPY trade too early of a proposition now.
If and when GBPJPY trades above 173.56, a stop can be placed beneath the last swing low of the triangle at around 167.40 with an upside target of 183.91. On the other hand, a close below 167.40 would trigger a sell signal for a bears to trade the triangle south with a target of 156.75.
After the last false breakout, traders may ask GBPJPY to “show them the pips” with a confirmed triangle breakout before going long GBPJPY a second time
Forum on trading, automated trading systems and testing trading strategies
Indicators: Levels
newdigital, 2013.11.13 07:42
How to Trade a Descending Triangle
Talking Points
===============
What is a Descending Triangle pattern?
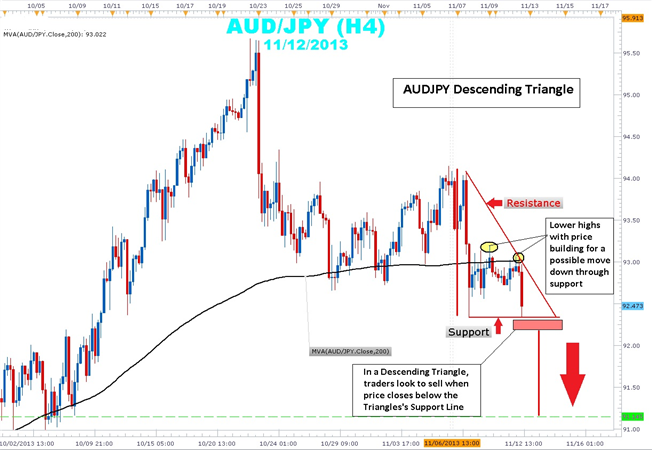
A descending triangle pattern is consolidation price pattern composed of lower swing highs pushed lower by an established downtrend line converging with a horizontal support made up of a series of swing lows located in roughly the same area. Another name for the descending triangle is the right triangle pattern due to its similarity to the geometric shape of the same name. The height of the triangle meets the horizontal support at a 90 degree angle.
Usually, descending triangles form as profit taking by sellers is met with bargain hunting buyers. However, the buying pressure is mutted as higher lows are not made. A news release or economic announcement could be the catalyst required to push price out of this coil tilting the balance strongly in the seller's favor. Unlike its cousins, the symmetrical triangle and ascending triangle, the descending lacks significant bullish participation indicated by that lack of higher lows.
Taking a look at the current AUDJPY 4-hour chart, you can clearly see price action bound between a descending trend line that connects the 11/6 swing high of 94.15 to 11/12 swing high of 93.05. This swing high is a lower swing high than the 11/10 93.19 swing high showing the building strength in the downtrend. Current price action within the triangle is below the 200 simple moving average (SMA), a key indicator that traders use to determine bullishness or bearishness.
Traders will watch price action for a 4-hour candle close below support to confirm that there is follow through in a potential breakout. Stops can be placed near the middle of the triangle just above the 93.00 and 200 SMA. The height of the triangle is a little over 170 pips. By extending this height from the support level of a potential breakout zone, look for a possible target of 91.14. The profit target coincides with the lows seen back on October 2nd.
In summary, descending triangles can be an excellent way to rejoin a downtrend that clearly illustrates risk and reward. Price has a tendency to break form the descending triangle in a downward direction.
Forum on trading, automated trading systems and testing trading strategies
Something Interesting in Financial Video November 2013
newdigital, 2013.11.13 07:52
How To Trade Descending Triangle Chart PatternsVideo Tutorial on How To Trade Descending Triangle Chart Patterns