Indicators: Accumulation Swing Index (ASI)
Developed by Welles Wilder in his popular technical analysis book New Concepts in Technical Trading Systems, the Accumulative Swing Index (ASI) is mainly used as a divergence and confirmation tool, but can be used for buy and sell signals as well. It was designed to be used for futures trading, but can be used for stock trading and currency trading too. Basically, the Accumulative Swing Index is a running total of the Swing Index (see: Swing Index).
The chart below of gold futures shows the Accumulative Swing Index:
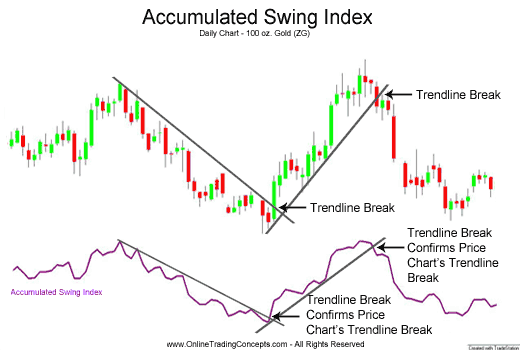
In the chart shown below, the Accumulative Swing Index confirmed Gold's downtrend. Subsequently, when Gold broke the downward trendline, the Accumulative Swing Index confirmed the trendline break as well.
Similarly, the upward move in the Gold futures contract was confirmed by the Accumulative Swing Index and the upward trendline break was confirmed too.
Buy Signal - Accumulative Swing IndexBuy when Accumulative Swing Index breaks above a downward trendline or, in a price consolidation period, above resistance.
Sell Signal - Accumulative Swing IndexSell when the Accumulative Swing Index breaks below an upward trendline or, in a price consolidation period, below support.
- Free trading apps
- Over 8,000 signals for copying
- Economic news for exploring financial markets
You agree to website policy and terms of use
Accumulation Swing Index (ASI):
ASI was created by Welles Wilder as an ordinary fluctuations indicator that gets signals from previous maximums and minimums of price. Once, Wilder said: "Somewhere amidst the maze of Open, High, Low and Close prices is a phantom line that is the real market." What helps us reveal this phantom line is the accumulation index.
In his book "New Concepts in Technical Trading Systems", Wilder describes the indicator this way:
"When the Index is plotted on the same chart as the daily bar chart, trend lines drawn on the ASI can be compared to trend lines drawn on the bar chart. For those who know how to draw meaningful trend lines, the ASI can be a good tool to confirm trend-line breakouts. Often erroneous breaking of trend lines drawn on bar charts will not be confirmed by the trend lines drawn on the ASI. Since the ASI is heavily weighted in favor of the close price, a quick run up or down during a day's trading does not adversely affect the index."
With the ASI attempting to show the "real market," it closely resembles actual prices. This allows usage of classic support/resistance analysis on the ASI. Standard analysis involves looking for breakouts, new highs and lows, and divergences. Wilder points out the following characteristics of ASI:
Author: MetaQuotes Software Corp.