Two EMA's crossing
I just found something in MT5 Codebase so hope it will help :
Forum on trading, automated trading systems and testing trading strategies
Indicators: Custom Moving Average
newdigital, 2013.07.31 07:44
Moving Average Crossover MethodThe cross over method uses two moving averages to generate trading signals. The first MA is a shorter period MA and the second average is a longer period MA.
This method is referred to as the crossover method because signals are generated when the two averages cross each other.
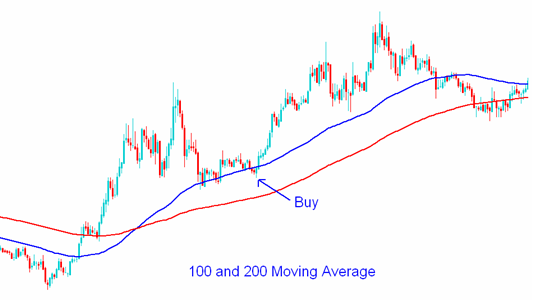
A buy is generated when the shorter MA crosses above the longer MA.
Sell signal
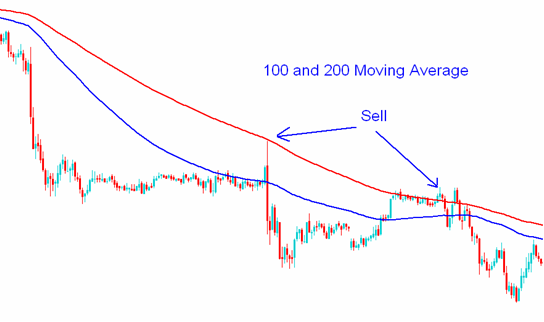
A sell is generated when the shorter MA crosses below the longer MA.
Buy and Sell signal
The above system is the most simplest of all systems that traders use to trade currencies.
Forum on trading, automated trading systems and testing trading strategies
Indicators: Custom Moving Average
newdigital, 2013.07.31 07:53
Short-term Forex Trading with Moving AveragesShort term trading will use short period moving averages such as the 10 and 20 moving average.
In the example below we use 10 and 20 moving averages to generate Forex signals; the signals generated are able to identify the trend as early as possible.
Scalper Trading Using Moving Averages
One of the most widely used method of technical analysis used to trade
price fluctuations in scalp trading is the use of moving averages.
moving averages is an indicator that provides a profitable chart
structure for scalp trader.
The idea behind moving averages is to simply enhance analysis before
taking a signal to enter the market. Planning and setting goals in the
short-term according to moving averages helps a trader to identify
interests in the market and thus trade accordingly.
Most of the targets can be established using a specific period on MA.
The moving averages determines whether the trader will scalp in a
short-term long-term. In addition, the price action above or below the
price determines the state of the market for the trading day.
If a large part of the price action is considered to be below the MA,
then bias trade/forex trend for the day is short. Most traders the use
the MA as support or resistance to determine where to enter a trade, if
price touches the MA in the direction of the forex trend a trade is then
opened.
The moving averages are plotted and the intersection point with the
price action can be used to determine the appropriate entry and exit
times in the market. Since there is always oscillation in the forex
trends and activities of the price action on the market, the price will
repeat this process of oscillating and bouncing off the MA and this can
be used to generate forex trading signals.
Scalp trader use moving averages define the price floor in an upward Forex trend and price ceiling in a downward Forex trend.
Simple moving averages are calculated and their approach is based on the
observation of price within a particular period of time using
sufficient data to calculate the moving averages is what moving average
are all about? The interpretation of the moving averages has provided
many scalp traders with lots of tips on how and when to trade a
currency.
Medium-term Trading with Moving Average
Medium term trading will use the 50 period MA.
The 50 period MA acts as support or resistance level for the price.
In an uptrend the 50 period MA will act as a support, price should always bounce back up after touching the MA. If price closes below the MA then it is an exit signal.
50 period MA Support
In a downtrend the 50 period MA will act as a resistance, price should always go down after touching the moving average. If price closes above the moving average then it is an exit signal.
50 Day Moving Average Analysis in the Forex Market
As your currency pair moves up in price, there is a key line you want to
watch. This is the 50 day moving average. If your currency pair stays
above it, that is a very good sign. If your currency pair drops below
the line in heavy volume, watch out, there could be reversal ahead.
A 50 day MA line takes 10 weeks of closing price data, and then plots
the average. The line is recalculated everyday. This will show a
currency pair's price trend. It can be up, down, or sideways.
You normally should only buy currency pairs that are above their 50 day
MA. This tells you the currency pair is trending upward in price. You
always want to trade with the trend, and not against it. Many of the
world's greatest traders, past and present, only trade or traded in the
direction of the trend.
When a successful currency pair corrects in price, which is normal, it may drop down to its 50 day MA.
Winning currency pairs normally will find support over and over again at
that line. Big trading institutions such as mutual funds, pension
funds, and hedge funds watch top currency pairs very closely. When these
big volume trading entities spot a great currency pair moving down to
its 50 day line, they see it as an opportunity, to add to, or start a
position at a reasonable price.
What does it mean if your currency pair price slices downward through
its 50 day line. If it happens on heavy volume, it is a strong signal to
sell the currency pair. This means big institutions are selling their
shares, and that can cause a dramatic drop in price, even if
fundamentals still look solid. Now, if your currency pair drops slightly
below the 50 day line on light volume, watch how the currency pair acts
in the following days, and take appropriate action if necessary
Long-term Trading with Moving Average
Long term trading will use long period moving averages such as the 100 and 200 moving average.
These moving averages act as long term support and resistance levels. Since many traders use the 100 and 200 moving averages price will often react to these support and resistance levels.
Learn about the 200 day MA
In Forex Trading, investors can use both fundamental analysis and
technical analysis to help determine whether a currency pair is a good
buy or sell.
In technical analysis technique traders looking to gauge supply and
demand for a currency use the 200 day moving average to examine data in
different ways.
Traders are most familiar with the basic analysis of MA. The 200 day
moving average is used to plot the long term support or resistance
level. If price is above 200 day MA then price is bullish, and if it is
below then it is bearish.
One of the ways to measure supply and demand is to calculate the average
closing price over the last 200 trading sessions. this accounts for
each day going back in time and shows how this 200 day average has moved
hence the term 200 day MA.
The reason why the average 200 day MA in particular is so popular in
technical analysis is because historically has been used with profitable
results for trading in the forex market. A popular timing strategy is
used to buy when price action is above its moving average of 200 days
and sell when it goes below it.
With individual currency pairs, investors can benefit from being
notified when a currency pair rises above, or falls below its 200 day
Moving Average and then use fundamental analysis to help determine if
the signal is an opportunity to go long or short.
Forum on trading, automated trading systems and testing trading strategies
Indicators: Custom Moving Average
newdigital, 2013.07.31 07:58
20 Pips Price Range Moving Average Forex StrategyThe 20 pips price range moving average strategy is used with the 1 Hour and 15 minute Trading charts. On this chart time-frames we use the 100 and 200 simple moving average indicator.
Both the 1 Hour and 15 minute chart time-frames will use the 100 and 200 SMA (SMA Indicator) to determine the direction of the Forex trend.
The 1 Hour chart time-frame checks the long term direction of the Forex trend, upward or downward trend, depending on the direction of the moving averages. All trades taken should be in this direction.
We then use the 15 minute price chart to find the optimal point to enter trades. Trades are opened only when the price is within 20 pips range of the 200 simple MA, if price is not within this pip range trades are not opened.
Buy Signal - Forex Uptrend/Bullish Market
To generate Forex buy (bullish signals) using the 20 pips moving average Forex trading strategy, we shall use the 1hour and 15 minute chart time-frame.
On the 1 hour Forex chart time-frame the price of the currency pair should be above both the 100 and 200 simple moving average. We then move to a lower chart time-frame, the 15 minute chart time-frame to generate a trade signal.
On 15 minute chart time-frame, when price reaches the 20 pips range above the 200 SMA, we open a buy trade and place a stop loss 30 pips below the 200 SMA. Stop loss can be adjusted to the amount of Pips that are suitable for your risk but to avoid being stopped out by normal Forex volatility its best to use 30 pips stop loss.
A buy trade can also be opened when price touches the 100 Simple moving average, provided it’s not very far from the 200 SMA. Normally the 100 SMA will be within the 20 pips range of the 200 SMA.
Sell Signal – Forex Downtrend/Bearish Market
To generate Forex sell (short signals) using the 20 pips moving average
Forex trading strategy, we shall also use the 1hour and 15 minute chart
time-frame.
On the 1 hour chart time-frame, the price should be below both the 100
and 200 simple moving average. We then move to the 15 minute chart
time-frame to generate a Trading Signal.
On 15 minute chart, when price reaches the 20 pips range below the 200 SMA, we open a sell trade and place a stop loss 30 pips above the 200 simple moving average.
With this method price will generally bounce of these levels because
many traders watch these levels, and open similar trades at around the
same point.
These levels act as short term resistance or support levels within the currency price charts.
Profit Taking level For This Trading Strategy
With this trading strategy the price will bounce and make a move in the
direction of the original Forex trend. This move will range from 70 -
100 pips.
The best profit taking level would therefore be considered to be 80 pips from the 200 simple moving average.
you can exchange money with my knowledge. lol.
this is the faster way out
You mean - Job service?
yes, you are right.
yes, i mean that. hopefully someone choose me to do the job
i've been rejected so many times...
yes, i mean that. hopefully someone choose me to do the job
i've been rejected so many times...
I am sorry for you, but please don't advertise yourself this way on the forum.
Thank you.
- Free trading apps
- Over 8,000 signals for copying
- Economic news for exploring financial markets
You agree to website policy and terms of use
Another question, is there any good programs that take to create a good EA? Some I have seen only afford to do simple things and my setup operation is now more complicated, need something richer...
Thanks!