Inside Bar Trading
Thanks for this info 
loosing is part of winning in trading,you shoul realise that no 100%winnig method,that one may fail, another trial may do just remember money management.
loosing is part of winning in trading,you shoul realise that no 100%winnig method,that one may fail, another trial may do just remember money management.
Very well said this has been my personal experience as well. this is what i have learned from the industry myself. thanks for such nice lines and ya a good post as well.
I well said this have been many personal experience as well as this is a learned from the industry myself.It is more useful for the trading and we earn the money by the trading.Inside trading is the trading of the corporation stock for other securities by individuals the potential access to non public information about the company or industries.
Most people ignore time frames,even some experts do,but are so crucial,most of the volatile trading occurs on lower time frames and causes ripples on longer timeframes!
If one thinks,one is smart to catch longer timeframes,the reverse happens,as the system,traders are always aware of it!
It is literally a "tussle" like 'pulling-the rope",those people trading on lower timeframes vs those on higher timeframes on this electronic two-way expressway!
Can somebody explain what "inside bar" trading is and why it is called this? Thanks
Dear Trader
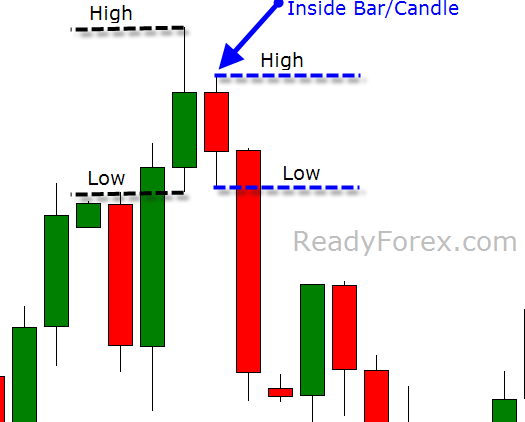
After a big bar you get a small "Inside bar"
The trading range of an inside bar/inside candlestick - the high's
and low's never takes out the high's and low's of previous
closed bar or Candle
An inside bar is just an opposite of an outside bar pattern.
Let me show you an image of an inside bar with blue arrow.
Kind regards,
-Muhammad Azeem
The trading range of an inside bar/inside candlestick - the high's
and low's never takes out the high's and low's of previous
closed bar or CandleAn inside bar is just an opposite of an outside bar pattern.Let me show you an image of an inside bar with blue arrow.even some experts do,but are so crucial,most of the volatile trading occurs on lower time frames and causes ripples on longer timeframes!If one thinks,one is smart to catch longer timeframes,the reverse happens,as the system,traders are always aware of it!It is literally a "tussle" like 'pulling-the rope",those people trading on lower timeframes vs those on higher timeframes on this electronic two-way expressway!
Since they indicate a sideways market, the best way to deal with inside bars is to set breakouts +20 pips above the high of the IB and -20 pips below the bottom of the IB. When the market does break out of the doldrums, you can win
Dear Trader After a big bar you get a small "Inside bar" The trading range of an inside bar/inside candlestick - the high's and low's never takes out the high's and low's of previous closed bar or Candle An inside bar is just an opposite of an outside bar pattern. Let me show you an image of an inside bar with blue arrow.
Thank you for giving me a clear explanation. I got it now.
- Free trading apps
- Over 8,000 signals for copying
- Economic news for exploring financial markets
You agree to website policy and terms of use
Looking for a little understanding.
Inside bar formed on the GBP/USD at 7:00 am CST. Using the 1 hr chart.
To the left of the inside bar candle - the candle was green. The inside bar candle was red. Stoch's were overbought. Everything I read to this point was is if on the new candle it drops below where the IB candle ended by 5 or so PIP's I should sell (in this case). It drop 5 and I sold, however, it retraced 40 pip's up so I ended up getting stomped out.
The question I have are:
From this chart and explaination what did I do wrong?
What other information should I have been looking for?
What does the colors of the IB candle and the candle to the left of it tell me?
Thanks,
Kurt