The Fibo Method which works...
As we move forward we discover a strategy that fits only chosen currency pairs.
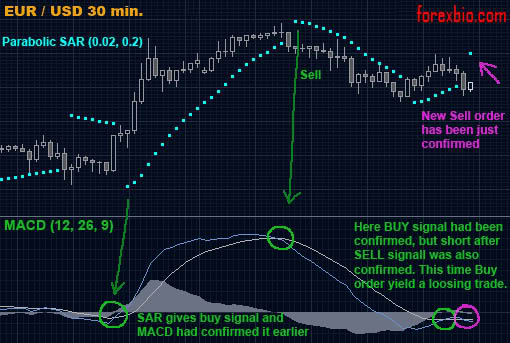
Take a look at the next Forex trading system:
Currency pair: EUR/USD.
Time frame: 30 min.
Indicators: MACD (12, 26, 9), Parabolic SAR default settings (0.02, 0.2)
Entry rules: When Parabolic SAR gives buy signal and MACD lines crossed upwards – buy
When Parabolic SAR gives sell signal and MACD lines crossed downwards – sell
Exit rules: exit at the next MACD lines crossover or if the market starts trading sideways for some time.
You are missing trading opportunities:
- Free trading apps
- Over 8,000 signals for copying
- Economic news for exploring financial markets
Registration
Log in
You agree to website policy and terms of use
If you do not have an account, please register
Hi All
Most of you are already aware of the Fibonacci level and how they are very present in the market all the time. Fibonacci is an interesting indicator in the sense that it is a leading indicator and does not lag behind price. Fibonacci is mostly used in price action based systems. If you don't know how to draw a Fibonacci retracement on your chart, please do a little search on the forum or on youtube. Infact is is very easy to do with the default fibo tool which comes with the metatrader platform. You just have to indentify the lastest move and draw the fibo from low to high if it is an upmove and from high to low if it is a down move.
The method should work on any pair and timeframe. However, I suggest that we use some higher timeframe to work on such as the H1 and H4 as these timeframe has less market noise which will definitely protect us from false signals and bad trades.
There are various fibo levels and the 2 levels which we are going to use are the 38.2 and 61.8 levels. We are only to focus on these 2 levels. First, place the MTF_Moving_Average indicator on your chart with the following settings TimeFrame 1440, MAPeriod 50, Shift 0, Method 1, Price 0.
The MTF Moving Average will be giving us a visual clue about the trend and direction the market is heading on a higher timeframe, in our case, we will be getting the readings from the daily chart.
1. We need to look at the MTF Moving Average, if it is stepping down, then we will only take short trades and if it is stepping up, then we will only be taking long trades. In this way, we will be sure to trade with the major trend prevailing 80%-90% of the time. As you might have already heard before, the trend is your friend.
2. We need to find the latest move on our current chart which went in the direction of the trend (MTF MA direction) and which has not retraced to the 38.2 level yet and we draw our fibo retracement level on this move... Sooner or later it will do it.
3. After we have identified this move, we place a pending order in the direction of the trend with stoploss at 61.8 level and a trailing stop of 75 pips.
4. We place another pending order at 61.8 level with a stoploss of 100pips and a trailing stop of 75 pips. We are using high values because we are working on higher timeframes. Of you try this on lower timeframes, make sure you adjust these values accordingly.
These are the basic rules of this fibonacci trading method and they are fairly easy to understand and master. We have only 2 possible outcomes for each trade, either the market goes against the trade and hit the Stoploss or it goes in the expected direction, activating the trailing stop and eventually close in profit.
The system as it is can be called a trend trading system as we are always taking the trades in the direction of the trend. However, if you are experienced enough and you would like to take trade against the main trend, then my advice will be to always use take profit levels and keep them small. Trading against the trend can be risky at times.
So here we are, another good trading method which should work over and over in any pair and market condition. Just be sure to master your risk and use a good money management system that should keep your account healthy enough to sustain a few losses from time to time. Would like to hear back from your experience with the method. Good Luck