Custom indicators: Kairi, PCR, KRV ...
Hi amarnath. Thanks for sharing man. Here you go the first wave:
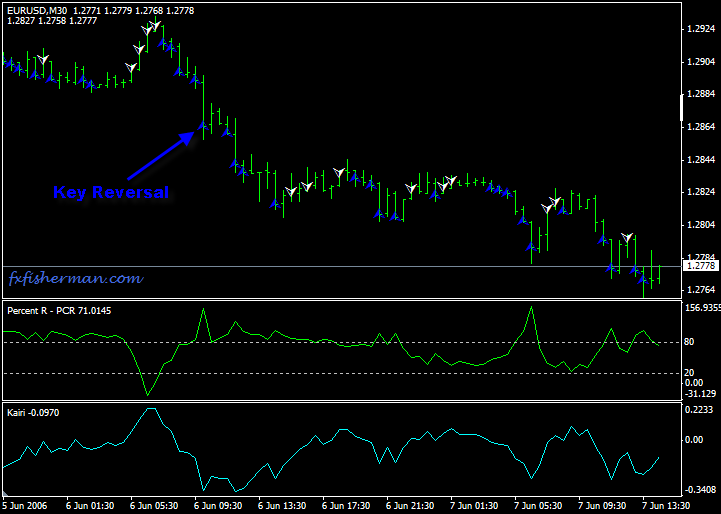
- Key Reversal
- Trend (Reversed of Key Reversal)
- Kairi
- Percent R
I really like these indicators. They're just unique and amazing! Take PCR as example, buy when it's 30 and sell when it's 70. I've got pretty good looking setup here. And, I just reverse up the "Key Reversal" to make Trend indicator. I think it's better.
I may made some mistakes though as your explanation is foggy. Like the ACD method, what exactly are TrueLow and TrueHigh? Are they calculated like in ATR?
Do you think i coded them right?
Dear Scorpion,
Thanks for coding indicators . Its nice to see you reversed concept of KRV  to get price following indicator but i feel if you we have it as color histogram bar is better than arrow outlooks for pleasing look while trading
  .
.
amarnath, the Cycle is now coded. Download from https://www.mql5.com/en/forum/194299
 wow thx u
difficult to use and see
Hi guys,
Iam looking for Key reversal indicator for Metatrader, if anyone have it, request you to post it here.
Thanks in Advance
sridhar
Does anyone have this Percent R to share?
Does anyone have this Percent R to share?
Maybe already you have it.
There is a "Williams' Percent Range" in Oscillator folder in the Navigator, no?
- Free trading apps
- Over 8,000 signals for copying
- Economic news for exploring financial markets
You agree to website policy and terms of use
Hi Scorpion,
Thanks for such assistance to develop indicators for non programmers. I have few ideas i like to see as MT ind as i programmer friend is still busy i hope you can help me to get these formula as indicators.
Kairi
It calculates deviation of the current price from its simple average
as percent of moving average. If the percent is rather high and
positive - is signals to sell, large and negative - to buy.
Parameter - period of averaging n, boundary of signals BUY, SELL-pers.
Formula:
k = [ p - sma (n)/ sma(n) ] 100
Buy: K> pers
Sell: K< - pers
----------------------------------------------------
ACD
ACD method compares demand and supply pressure by way of accumulating
upward and downward price movement. Upward price movement is measured
as a difference between true low value of the price and closing price,
movement downward - the difference between true upper value and
closing price. The signal to buy is generated, when ACD indicator
exceeds the set percent of its maximum value for some historical
period.
Methods parameter is value of historical period N and percent
determining maximum deviation.
ACD=ACD[1]+V
v=Close-TrueLow (Close > Close[1])
v=Close-TrueHigh (Close < Close[1])
Buy: ACD> -p*max(ACD)N
Sell: ACD< p*max(ACD)N
_______________________________
Percent R - PCR
It calculates how close is the price to the highest (the lowest) price
for the set period of time as a percent of price range for that period
of time. It is based on support and resistance levels. PCR value close
to 80% signals to sell, when it is equal to 20% - to buy.
Parameter - period of averaging n.
Formula:
h = max ( p, p[1] , k , p (n)
l = min ( p, p[1] , k , p (n)
pcr = ( h - p / h - l ) * 100
_________________________
Key Reversal - KRV
It signals that the trend has changed. In case of pronounced downward
trend during the set historic period n it signals to buy, if the
highest price exceeds the previous highest, the lowest stock price is
below the previous lowest and the closing price exceeds the previous
closing price. Signal to sell is produced in the same situation after
pronounced upward trend, in case the closing price is below the
previous closing price.
Parameter: historical period of trend determination n.
BUY: High>High[1] , Low>Low[1], Close>Close[1], Trend(n)=down
BUY: High>High[1] , Low>Low[1], Close<Close[1], Trend(n)=up
______________________________________
cycle
close - open / high - low