Sharpe ratio calculation in MT5 is very unrealistic
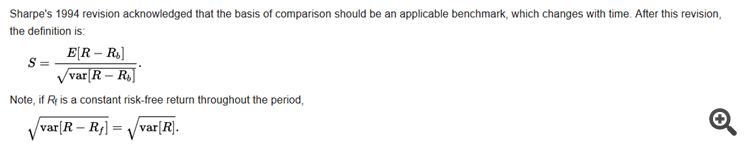
@ Sergey: I think the only correct Sharpe ratio definition comes from Sharpe himself, that's why I copied his revised formula.
If there were many correct ways to calculate a Sharpe (or any other) ratio, then it would be useless for any comparison.
@ Juer: I don't make 3rd part apps, but it's not so hard to calculate. What is more important is that you should be aware what you are comparing to what.
If you compare 2 strategies that have both used X capital and were over over time period Y, then YOU can use the "MQL5 Sharpe ratio" to compare two strategies.
But it doesn't say anything in comparing your "MQL5 Sharpe ratio" with others ratio, or having used other test variables like capital or time period tested over.
I do not know about MQL5 Sharpe (about which one they took as a based one for the calculation), but I remember - I made one post about Sharpe many years ago:
Forum on trading, automated trading systems and testing trading strategies
Rent a Signal service development and suggestions
Sergey Golubev, 2009.01.12 07:47
Sharpe Ratio was added to advanced stats (thanks to Igorad).
Mathematics in Trading: How to Estimate Trade Results - MQL4 Articles
There are Sharpe Ratio, Modified Sharpe Ratio and Annual Sharpe Ratio. Sharp Ration telling us about stability (consistently) of the profit for some signals (lowest value compare with Modified Sharpe Ratio and Annual Sharpe Ratio) The Sharpe Ratio
Sharpe Ratio is not telling us about how profitable the system/signals. It is telling us about stability of the income.
For example,
- one signals did 0.1% for the 1st month, 0.1% for the second month and 0.1% for the 3rd month. Sharpe Ratio will be very hight. Because it is stable income every month. Same with banks for example if you will deposit money to them.
- other signals did 1% return for the 1st month, -2% return for the second month and 5% for the 3rd month. Sharpe Ratio will be low. Because this signal provider is not giving stable consistent profit for every period of time.
For example, the signal <...> (by <...>) is having Sharpe Ratio = 2.65 which is very good. If the signals are profitable so it indicates that it may be very good to subscribe.
So, the buyers should look at Sharpe Ratio (stable income or not stable income), after that we can look at ROI, at max/min lot size, and how many pairs the signal provider is trading (it is difficult to receive big Sharpe Ratio for 1 pair during the long period of time trading) and so on.
Just for information.
So, according to my opinion - the Sharpe Ratio is very difficult to use in forex. For example, many people understand the following: "subscription to the signal = investing" ("I decided to invest my money to subscribe to the signal"). And they may ask: how much profit will I have monthly/yearly? 2% from deposit? 10%? or 20% yearly (20% every year) ... but we know that it is impossible to estimate the fix profit from the investment in the forex for example ....
Sharpe Ratio may be good to use/to estimate in portfolio when we need the stability in income (small profit but same one every month/year for example).
Yes, and this article from Sharpe:
The Sharpe RatioWilliam F. Sharpe
Stanford University
Reprinted fromThe Journal of Portfolio Management, Fall 1994
fxmz8008:
b. It doesn't take into
account the amount of capital used - it assumes "all". That causes that
it is irrelevant for the SR if you have achieved the results using 1% or
100% of the capital, which is of course nonsense. (If with only 1% you
would also have fixed returns on the other 99% of the capital - see a.).
Besides the fact that the way of calculation is unrealistic, it leads (more importantly) to wrong conclusions: in the example two strategies can have exactly the same SR while the 1% capital used one is of course way better because, besides of returns, 99% of capital has been always safe. It should use the average used capital over the time period.
.
In short, the number you calculate this way is very far from the truth
Just because you are using only 1% of your margin to open a position, does not mean you are risking 1%... unless your leverage is 1:1
Sharpe does not means more profit, instead, it means more STABLE profit.
Mens Less surprises during the way...
Here is a money growing curve, Sharpe Ratio 0.82, Profit $948.72
Those "Jumps" in red, penalize the Sharpe Ratio, because they breaks Sharpe linearity.
We can see two parts which had an excellent sharpe ratio (marked Pink, indicated by Blue arrows)
Than a suddenly a Jump, (means some uncommon profit happened), causing those jumps on the money growing curve
(but they(the jumps) could be also be Jumps going Down, being uncommon Losses too)
Anything which causes surprises on the growing curve, breaking its linearity, penalizes the Sharpe Ratio.

Now the same example, with different settings on the EA:
Sharpe ratio now is 1.10, we can clearly see that it has a very linear growing curve.
Which means, there was fewer surprises
This growing curve is much more Stable than the curve on the other picture.
Although the Final Profit here was less than the other one ( $861.23 versus $948.72 )

MT5 Sharpe Calculation is very precise.
Better Sharpe Ratio = More Trustable = More Stable Money Growing
More Stable does NOT mean 'more money'.
More Stable means smoother and better linear growing curve, with less surprises, or almost none surprises (if Sharpe is above 1.5 or even higher)
To measure Profit and investments: use AHPR and GHPR (this will give you a perfect view about
money percentage growing and predictablity and expectations for the next months, years, etc.)
To measure Robots: the performance, trustability, expectation, and how it performs: use MFE and MAE
where MAE is a much better indication, but study both, as you can make a correlation between them.
Alternative risk return metrics in MQL5


- www.mql5.com
- Free trading apps
- Over 8,000 signals for copying
- Economic news for exploring financial markets
You agree to website policy and terms of use
I think the way MT5 calculates the Sharpe Ratio (SR) as explained here https://www.mql5.com/en/forum/1372/page2 is incorrect.
For several reasons:
a, It assumes a RiskFreeReturn of 0. Rate on 10 year US government bond is 2.23% (source: https://www.treasury.gov/resource-center/data-chart-center/interest-rates/Pages/TextView.aspx?data=yield)
As a consequence of this, you get unrealistic SR's (see next item). You might set it to zero for simplicity's sake, but that is not the way to go when presenting a well known ratio - stick to the formula. Besides that it also stays roughly the same for a year or so, so only a yearly update would already make it way more realistic.
b. It doesn't take into account the amount of capital used - it assumes "all". That causes that it is irrelevant for the SR if you have achieved the results using 1% or 100% of the capital, which is of course nonsense. (If with only 1% you would also have fixed returns on the other 99% of the capital - see a.).
Besides the fact that the way of calculation is unrealistic, it leads (more importantly) to wrong conclusions: in the example two strategies can have exactly the same SR while the 1% capital used one is of course way better because, besides of returns, 99% of capital has been always safe. It should use the average used capital over the time period.
c. It doesn't take into account the time period. Now two strategies can have the same result/risk, resulting in the same SR, while one generated that result in one month while the other one did it in a year. Would you consider these both as good?
Source: https://en.wikipedia.org/wiki/Sharpe_ratio
.
In short, the number you calculate this way is very far from the truth