Something Interesting to Read February 2014
Getting Started Patterns : Thomas Bulkowski
An accessible guide to understanding and using technical chart patterns
Chart pattern analysis is not only one of the most important investing
tools, but also one of the most popular. Filled with in-depth insights
and practical advice, Getting Started in Chart Patterns is designed to
help both new and seasoned traders profit by tracking and identifying
specific chart patterns. Expert Thomas Bulkowski opens with a basic
discussion of chart pattern formation and how bad habits can hurt
trading. He then moves on to introduce over 40 key chart formations as
well as numerous trading tactics that can be used in conjunction with
them. Readers will benefit from the specifics (actual trades with dollar
amounts) outlined throughout the book and the frank discussions of how
trading behavior can affect the bottom line. Anecdotes from Bulkowski's
own trading experiences are also included to shed light on how one of
the best in the business goes about trading with chart patterns.
Advanced Swing Trading : John Crane
The essential ingredients required for swing trading have been around
for decades. The fact is that as long as human behavior remains the
same, market behavior will be the same. As a result of this natural
phenomenon, every market–whether it be stocks or commodities–offers
swing trading opportunities. But finding these opportunities and
capitalizing on them can be a daunting task if you’re unprepared.
In Advanced Swing Trading, John Crane, a veteran trader and cofounder of
Traders Network, discusses his work with Action/Reaction trading
theory, and illustrates a whole new way of using time, price, and
patterns to predict, identify, and trade future market swings. Chapter
by informative chapter, you’ll be introduced to the concepts that
encompass this proven method, including:
Market behavior
Reaction swings
Swing trading reaction swings
The Reaction cycle
Action and reaction lines
Entering and exiting trades
Reversal dates
Long-term versus short-term trends
And much more
Advanced Swing Trading deals with Action/Reaction theory by combining
price levels, timing methods, and confirmation patterns that strengthen
the predictability of future market moves. This practical and revealing
book takes a step-by-step look at the Action/Reaction theory and shows
you how to profit as markets go through a complete and predictable cycle
that is known as the Reaction cycle. Using this technique, you’ll learn
how to predict the beginning of a new trend and then project the time
and price of the center and end of new trends.
By using unique techniques such as action lines and reaction lines
within the Reaction cycle, you’ll also discover how to predict the time
and price of major market reversals. With this knowledge in hand, you’ll
know whether the market is going to make a major turn or if it’s only
going to make a small correction against the prevailing trend.
Packed with proven strategies from a respected veteran, real-world
examples and clear-cut charts, Advanced Swing Trading provides an
in-depth overview of the art of swing trading. This comprehensive book
offers you the step-by-step guidance that will allow you to apply
powerful swing trading techniques to any portfolio–without making it a
full-time job–and gives today’s investors fresh new methods needed to
consistently improve their bottom line.
High Profit Candlestick Patterns : Stephen Bigalow
High profit trading patterns, revealed by utilizing time-honored
Japanese candlestick signals. A straight-forward approach to
understanding and exploiting market opportunities. Practical
applications to predict stock price movements consistently and
profitably, a winning system in good times or bad! All detailed in:
"High Profit Candlestick Patterns: Turning Investor Sentiment into
Profits" By Stephen W. Bigalow
Don’t play the market, Beat the Market! Stephen W. Bigalow’s first book
"Profitable Candlestick Trading" taught the novice investor how to
quickly identify the best trading opportunities. Now his new book, "High
Profit Candlestick Patterns" takes his teaching to the next level.
Combining the proven results of Japanese Candlestick charting with
effective Western technical analysis, produces even higher profit
wealth-building stock selection techniques. Learn the key to profitable
stock selection with this safer approach to investing and avoid
expensive trading mistakes. Quickly learn the simplest, yet most
intelligent, approach to stock selection. Candlestick signals visually
produce compelling results. Japanese candlestick charting techniques,
integrated with statistically proven Western technical analysis,
produces an even more powerful investment platform. The ability to
recognize trading patterns in their very early stages empowers an
investor with high profit trading strategies.
For the technical investor, the combined analysis provides potent
trading programs. The fundamental investor gains tremendous insights
into the timing of positions. The introduction of cutting-edge computer
generated technical analysis, with the world's most proven trading
technique, becomes a powerful tool for understanding the movements of
the markets. Discover simple techniques that put the probabilities
highly in your favor.
Japanese candlestick signals provide an immense amount of information.
They graphically depict what is occurring in investor sentiment. This
alone provides a huge advantage for the investor. Having the ability to
identify reversals in price trends, utilizing statistically proven and
utilized signals, allows an investor to develop high profit trading
strategies. The psychological elements not only reveal trend reversals,
but they provide the insights for understanding why that reversal is
occurring. This becomes a very powerful investment tool.
The graphic illustrations in this book are simple common sense
revelations. Utilizing candlestick signals in conjunction with Western
technical patterns produces two strong investment elements. First, it
allows for the recognition of the optimal times for entering a trade.
Second, the candlestick signals revealed immediately when the trend
pattern is not performing correctly, allowing for quick exits.
You will receive a whole new perspective for profitably investing in the
markets. You do not have to learn formulas nor develop investing
talents. The combination of candlestick signals with easy-to-identify
trading patterns will vastly expand your investment confidence. The
self-mastery of profitable investing is greatly simplified with quick
visual evaluations.
Guppy Trading, Essential Methods For Modern Trading : Daryl Guppy

A compilation of the very best of Daryl Guppy
Daryl Guppy has been one of Australia's foremost experts on share
trading and charting for almost 20 years. His first book, Share Trading,
is still a must-read for people wanting to learn about the market and
is widely accepted as the best-selling trading book ever in Australia.
Guppy Trading contains detailed analysis of many topics, including:
making effective trades based on news events and informed trading
advanced application of the Guppy Multiple Moving Average to assess the true strength of a trend
how to establish and improve trade entry, exit and stop loss points in volatile markets
effective trading of international markets
safely integrating derivatives to boost portfolio returns.
Guppy Trading contains 23 of the most enduring and important chapters
from Guppy's earlier books, completely revised, and combines them with
10 entirely new chapters. These new chapters detail new trading methods
and instruments that have been developed to create additional
opportunities and ensure survival in interconnected modern markets. This
comprehensive compendium is critical reading for traders looking to
maximise their returns.
=================
MT5 CodeBase :
Forum on trading, automated trading systems and testing trading strategies
How to Start with Metatrader 5
newdigital, 2013.07.15 21:19
Just good indicator found in Metatrader 5 CodeBase : GUPPY MULTIPLE MOVING AVERAGES :
These are two groups of exponential moving averages. The short term group is a 3, 5, 8, 10, 12 and 15 day moving averages. This is a proxy for the behaviour of short term traders and speculators in the market.
The long term group is made up of 30, 35, 40, 45, 50 and 60 day moving averages. This is a proxy for the long term investors in the market.
The relationship within each of these groups tells us when there is agreement on value - when they are close together - and when there is disagreement on value - when they are well spaced apart.
The relationship between the two groups tells the trader about the strength of the market action. A change in price direction that is well supported by both short and long term investors signals a strong trading opportunity. The crossover of the two groups of moving averages is not as important as the relationship between them.
When both groups compress at the same time it alerts the trader to increased price volatility and the potential for good trading opportunities.
==========
The Guppy Multiple Moving Average (GMMA) is an indicator that tracks the inferred activity of the two major groups in the market. These are investors and traders. Traders are always probing for a change in the trend. In a downtrend they will take a trade in anticipation of a new up trend developing. If it does not develop, then they get out of the trade quickly. If the trend does change, then they stay with the trade, but continue to use a short term management approach. No matter how long the up trend remains in place, the trader is always alert for a potential trend change. Often they use a volatility based indicator like the count back line, or a short term 10 day moving average, to help identify the exit conditions. The traders focus is on not losing money. This means he avoids losing trading capital when the trade first starts, and later he avoids losing too much of open profits as the trade moves into success.
We track their inferred activity by using a group of short term moving averages. These are 3, 5, 8, 10, 12 and 15 day exponentially calculated moving averages. We select this combination because three days is about half a trading week. Five days is one trading week. Eight days is about a week and a half.
The traders always lead the change in trend. Their buying pushes prices up in anticipation of a trend change. The only way the trend can survive is if other buyers also come into the market. Strong trends are supported by long term investors. These are the true gamblers in the market because they tend to have a great deal of faith in their analysis. They just know they are right, and it takes a lot to convince them otherwise. When they buy a stock they invest money, their emotions, their reputation and their ego. They simply do not like to admit to a mistake. This may sound overstated, but think for a moment about your investment in AMP or TLS. If purchased several years ago these are both losing investments yet they remain in many portfolios and perhaps in yours.
The investor takes more time to recognize the change in a trend. He
follows the lead set by traders. We track the investors inferred
activity by using a 30, 35, 40, 45, 50 and 60 day exponentially
calculated moving average. Each average is increased by one week. We
jump two weeks from 50 to 60 days in the final series because we
originally used the 60 day average as a check point.
This reflects the original development of this indicator where our focus was on the way a moving average crossover delivered information about agreement on value and price over multiple time frames. Over the years we have moved beyond this interpretation and application of the indicator. In the notes over the coming weeks we will show how this has developed.
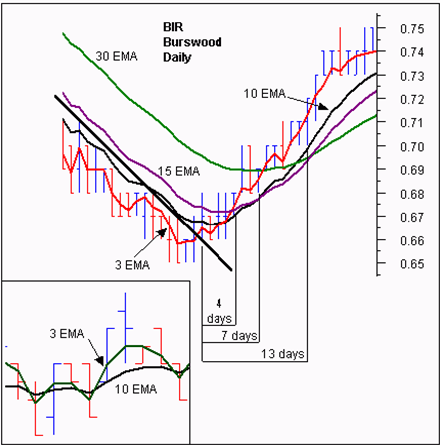
Our starting point was the lag that existed between the time of a genuine trend break and the time that a moving average cross over entry signal was generated. Our focus was on the change from a downtrend to an up trend. Our preferred early warning tool was the straight edge trend line which is simple to use and quite accurate. The problem with using a single straight edge trend line was that some breakouts were false. The straight edge trend line provided no way to separate the false from the genuine.
On the other hand, the moving average crossover based on a 10 and 30 day calculation, provided a higher level of certainty that the trend break was genuine. However the disadvantage was that the crossover signal might come many days after the initial trend break signal. This time lag was further extended because the signal was based on end of day prices. We see the exact cross over today, and if we were courageous, we could enter tomorrow. Generally traders waited for another day to verify that the crossover had actually taken place which delayed the entry until 2 days after the actual crossover. This time lag meant that price had often moved up considerably by the time the trade was opened.
The standard solution called for a combination of short term moving averages to move the crossover point further back in time so that it was closer to the breakout signaled by a close above the straight edge trend line. The drawback was that the shorter the moving average, the less reliable it became. In plotting multiple moving averages on a single chart display four significant features emerged.
They were:
- A repeated pattern of compression and expansion in a group of six short term averages.
- The behavior was fractally repeated across different time frames. These short and long term groups were useful in understanding the inferred behavior of traders and investors.
- The degree of separation within groups and between groups provides a method of understanding the nature of the trend and trend change.
- The synchronicity was independent of the length of the individual moving averages. That is, at major trend turning points compression occurred across both long and short term groups and this provided early validation of signals generated by the straight edge trend line
- The relationship between moving averages and price was better understood as a relationship between value and price. The crossover of two moving averages represented an agreement on value over two different time frames. In a continuous open auction which is the mechanism of the market, agreement on price and value was transient and temporary. Such agreement often preceded substantial changes in the direction of the trend. The GMMA became a tool for identifying the probability of trend development.
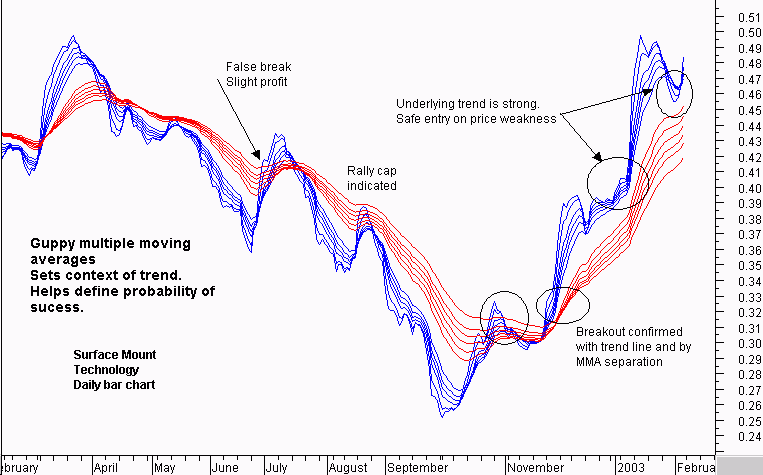
These broad relationships, and the more advanced relationships used with the GMMA are summarized in the chart. Over the following series of articles we will examine the identification and application of each of these relationships.
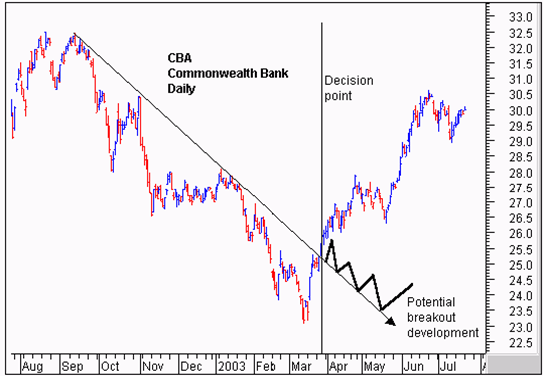
This is the most straightforward application of the GMMA and it worked well with “V’ shaped trend changes. It was not about taking the lag out of the moving average calculation. It is about validating a prior trend break signal by examining the relationship between price and value. Once the initial trend break signal is validated by the GMMA the trader is able to enter a breakout trade with a higher level of confidence.
The CBA chart shows the classic application of the GMMA. We start with the breakout above the straight edge trend line. The vertical line shows the decision point on the day of the breakout. We need to be sure that this breakout is for real and likely to continue upwards. After several months in a downtrend the initial breakout sometimes fails and develops as shown by the thick black line. This signals a change in the nature of the trend line from a resistance function prior to the breakout to a support function after the breakout.
The GMMA is used to assess the probability that the trend break shown by the straight edge trend line is genuine. We start by observing the activity of the short term group. This tells us how traders are thinking. In area A we see a compression of the averages. This suggests that traders have reached an agreement on price and value. The price of CBA has been driven so low that many traders now believe it is worth more than the current traded price. The only way they can take advantage of this ‘cheap’ price is to buy stock. Unfortunately many other short term traders have reached the same conclusion. They also want to buy at this price. A bidding war erupts. Traders who believe they are missing out on the opportunity outbid their competitors to ensure they get a position in the stock at favorable prices.
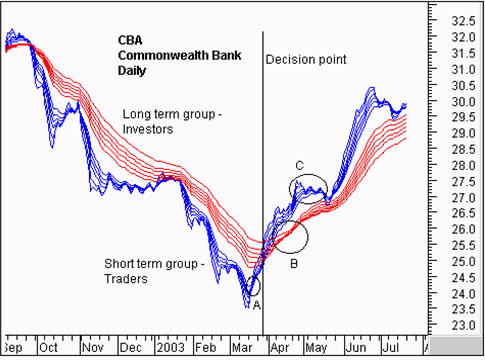
The compression of these averages shows agreement about price and value. The expansion of the group shows that traders are excited about the future prospects of increased value even though prices are still rising. These traders buy in anticipation of a trend change. They are probing for a trend change.
We use the straight edge trend line to signal an increased probability of a trend change. When this signal is generated we observe this change in direction and separation in the short term group of averages. We know traders believe this stock has a future. We want confirmation that the long term investors are also buying this confidence.
The long term group of averages, at the decision point, is showing signs of compression and the beginning of a change in direction. Notice how quickly the compression starts and the decisive change in direction. This is despite the longest average of 60 days which we would normally expect to lag well behind any trend change. This compression in the long term group is evidence of the synchronicity relationship that makes the GMMA so useful.
This compression and change in direction tells us that there is an increased probability that the change in trend direction is for real – it is sustainable. This encourages us to buy the stock soon after the decision point shown.
The GMMA picks up a seismic shift in the markets sentiment as it
happens, even though we are using a 60 day moving average.. Later we
will look at how this indicator is used to develop reliable advance
signals of this change. This compression and eventual crossover within
the long term group takes place in area B. The trend change is
confirmed. The agreement amongst investors about price and value cannot
last. Where there is agreement some people see opportunity. There are
many investors who will have missed out on joining the trend change
prior to area B. Now the change is confirmed they want to get part of
the action. Generally investors move larger funds than traders. Their
activity in the market has a larger impact.
The latecomers can only buy stock if they outbid their competitors. The stronger the initial trend, the more pressure there is to get an early position. This increased bidding supports the trend. This is shown by the way the long term group continue to move up, and by the way the long term group of averages separates. The wider the spread the more powerful the underlying trend.

Even the traders retain faith in this tend change. The sell off that takes place in area C is not very strong. The group of short term averages dips towards the long term group and then bounces away quickly. The long term group of averages show that investors take this opportunity to buy stock at temporarily wakened prices. Although the long term group falters out at this point, the degree of separation remains relatively constant and this confirms the strength of the emerging trend.
The temporary collapse of the short term group comes after a 12% appreciation in price. Short term traders exit the trade taking short term profits at this level of return and this is reflected by the compression and collapse of the short term group of averages. As long term investors step into the market and buy CBA at these weakened prices, traders sense that the trend is well supported. Their activity takes off, and the short term group of averages rebounds, separates, and then run parallel to the long term group as the trend continues.
The GMMA identifies a significant change in the markets opinion about CBA. The compression of the short term and long term groups validates the trend break signal generated by a close above the straight edge trend line. Using this basic application of the GMMA, the trader has the confidence necessary to buy CBA at, or just after the decision points shown on the chart extract.
Using this straightforward application of the GMMA also kept traders out of false breakouts. The straight edge trend line provides the first indication that a downtrend may be turning to an up trend. The CSL chart shows two examples of a false break from a straight edge trend line. We start with decision point A. The steep downtrend is clearly broken by a close above the trend line. If this is a genuine trend break then we have the opportunity to get in early well before any moving average crossover signal.
This trend break collapses quickly. If we had first observed this chart near decision point B then we may have chosen to plot the second trend line as shown. This plot takes advantage of the information on the chart. We know the first break was false, and by taking this into account we set the second trend line plot. Can this trend break be relied upon? If we are right we get to ride a new up trend. If we are wrong we stand to lose money if we stay with a continuation of the downtrend. The straight edge trend line by itself does not provide enough information to make a good decision.
When we apply the GMMA we get a getter idea of the probability of the trend line break actually being the start of a new up trend. The key relationship is the level of separation in the long term group of averages, and trend direction they are traveling. At both decision point A and decision point B the long term group is well separated. Investors do not like this stock. Every time there is a rise in prices they take advantage of this to sell. Their selling overwhelms the market and drives prices down so the downtrend continues.
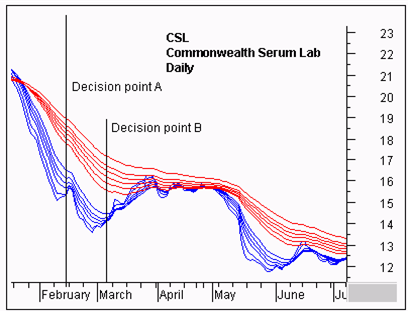
The degree of separation between the two groups of moving averages also makes it more difficult for either of the rallies to successfully change the direction of the trend. The most likely outcome is a weak rally followed by a collapse and continuation of the down trend. This observation keeps the trader, and the investor, out of CSL.
Looking forward we do see a convergence between the short term group of averages and the long term group of averages. Additionally the long term group begins to narrow down, suggesting a developing level of agreement about price and value amongst investors in April and May. In late March the 10 day moving average closes above the 30 day moving average, generating a classic moving average buy signal.
Trading Price Action Reversals : Al Brooks
detailed guide to profiting from trend reversals using the technical analysis of price action
The key to being a successful trader is finding a system that works and
sticking with it. Author Al Brooks has done just that. By simplifying
his trading system and trading only 5-minute price charts he's found a
way to capture profits regardless of market direction or economic
climate. His first book, Reading Price Charts Bar by Bar, offered an
informative examination of his system, but it didn't allow him to get
into the real nuts and bolts of the approach. Now, with this new series
of books, Brooks takes you step by step through the entire process.
By breaking down his trading system into its simplest pieces:
institutional piggybacking or trend trading, trading ranges, and
transitions or reversals (the focus of this book), this three book
series offers access to Brooks' successful methodology. Trading Price
Action Reversals reveals the various types of reversals found in today's
markets and then takes the time to discuss the specific characteristics
of these reversals, so that you can use them in your everyday trading
endeavors. While price action analysis works on all time frames, there
are different techniques that you can use in trading intraday, daily,
weekly and monthly charts. This, among many other issues, is also
addressed throughout these pages.
- Offers insights on how to handle volatility and sharp reversals
- Covers the concept of using options when trading certain charts
-
Examines how to deal with the emotions that come along with trading
Other books in the series include Trading Price Action Trends and Trading Price Action Trading Ranges
If you're looking to make the most of your time in today's markets the
trading insights found in Trading Price Action Reversals will help you
achieve this goal.
================
Forum on trading, automated trading systems and testing trading strategies
Something Interesting in Financial Video September 2013
newdigital, 2013.09.28 10:43
Interview With Al Brooks, Price Action Day Trader

Here is a summary of some of the key points:
1. Brooks is a price action trader with 27+ years of experience.
2. He is an active day trader, trading off the 5 minute chart. He trades the entire day.
3. He has a purely technical approach, relying totally on price action with just a few moving averages.
4. His approach is entirely rules-based; he not use any discretion and does not consider relying on intuition.
5. He states his setups have worked for decades and continue to work.
Brooks' analysis relies on measuring movements (i.e. retracements), gauging the strength of trends, and analyzing candlesticks.
Brooks has authored a number of books on trading. Interested traders may find it worthwhile to check out his page on Amazon.
Forum on trading, automated trading systems and testing trading strategies
Something Interesting in Financial Video September 2013
newdigital, 2013.09.28 10:38
Al Brooks' Moving Average Gap Bar StrategyThe basic elements of the strategy are as follows:
1. Identify a market that is in a bear trend on the 5 minute chart
2. Wait for a retracement in which the low of latest candle is above the 20 EMA
3. Go short, targeting the low of the day.
To be clear, Brooks' approach to price action trading is much more thorough; this strategy is just one tool in his arsenal.
Forum on trading, automated trading systems and testing trading strategies
newdigital, 2013.08.27 12:35
“If you trade Countertrend, you are gambling, and although you will often win and have fun, the math is against you, and you will slowly but surely go broke. Countertrend setups in strong trends almost always fail and become great With Trend setups..."-Al Brooks, Trading Price Action Bar By Bar
: Al Brooks: 9781118066614: Amazon.com: Books")
- reviews: 14
- 47.98 USD
- Al Brooks
- www.amazon.com
Candlestick charting Explained : Gregory L. Morris
Empower your trading with Japanese candlestick charting
Japanese candlestick charts dramatically improve your understanding of
short-term (less than a week) market sentiment, making you a much more
informed and focused trader of stocks, futures, and indices. The
bestselling Candlestick Charting Explained focuses on the patterns
themselves and highlights the key facts you need to know to apply each
pattern to your trading. For each of 89 distinctive candle patterns, its
standardized format provides you with:
- Commentary--Description of pattern and significance of its name, insights into unique features, and other concise explanation
- Rules of Recognition--Simple rules for quick, accurate identification along with precise, day-by-day descriptions of pattern development
-
Scenarios and Psychology Behind the Pattern--Trading scenarios that
could have led to the pattern's development, with general discussion of
the psychology of each
- day's action
- Pattern Flexibility--Situations that change the pattern's effectiveness with explanations of allowable deviations from the classic pattern
- Pattern Breakdown--Instructions for reducing the pattern to a single candle line and whether or not outside confirmation is suggested or unnecessary
- Related Patterns--Patterns that have similar formations, could be considered variations, or are a part of this pattern
-
Example--A graphic example of the pattern to both aid in recognition
and eliminate costly confusion in pattern identification
Additional information and insights present different interpretations of
candlesticks based on intraday instead of end-of-day events and action,
improving signal reliability. The author's unique candle pattern
filtering concept, instrumental in answering the "how" question, is
updated to utilize today's larger universe of stock data. An all-new
chapter provides practical application and perspective traders need to
view candles in the context of today's computer-driven marketplace.
For millions of traders, candlesticks have become a key tool in creating
and verifying trading signals. Candlestick Charting Explained is the
only book you need to start integrating their proven versatility and
effectiveness into your technical trading program.
=============
- Description on the forum : Libraries: MQL5 Wizard - Candlestick Patterns Class (many mini-articles with images)
- MQL5 Article : Analyzing Candlestick Patterns

- reviews: 36
- 28.63 USD
- Gregory L. Morris
- www.amazon.com
Tactical Trend Trading : Strategies For Surviving and Thriving In Turbulent markets- Robert Rubbens
Conventional wisdom has long insisted that the best—if not the
only—stock market strategy worth employing is the traditional
buy-and-hold model. But buy-and-hold investing is no match for today’s
turbulent markets, where real change happens every day and companies and
entire industries are stamped out in the blink of an eye. Fortunately,
there is a better way, one that enables market participants to preserve
their capital while increasing their net gains in even the most volatile
of markets. That way is trend trading, and with Tactical Trend Trading
as your guide, you will be better prepared than ever before to
tackle—and profit from—every curveball that today’s topsy-turvy markets
throw your way.
Written by hedge fund manager and trend trader Robert Robbins, Tactical
Trend Trading starts out from the basic premise that if market
participants learn to embrace change, they will be better able to
harness its ability to unlock profits in every corner of the markets. To
that end, Robbins equips you not only with the technical trading tools
you need to analyze the market backdrop and identify and trade with
market-prevailing trends, but also psychological guidelines that will
enable you to blast through the emotional obstacles that stand in the
way of profit generation and risk control. Rich in detail yet easy to
digest and implement, Tactical Trend Trading covers:
- The basics of trend trading, including what it is, its primary benefits and drawbacks, what type of commitment it entails, and how you can use it every day to profit from market volatility;
- How to leverage technical analysis and sentiment indicators to pinpoint profit-generating stocks, sectors, and trends, predict market corrections, and execute perfectly timed trades;
- Mental strategies for surmounting the ingrained psychological and emotional habits that prevent traders from realizing true financial success;
- Techniques for developing a systematic approach to the markets that will enable you to survive and thrive in up, down, and sideways markets;
And much more.
Along the path to becoming a successful trend trader, your technical
acumen and mental fortitude will be tested every step of the way.
Prepare yourself for the brave new world of today’s ever-changing
financial markets with Tactical Trend Trading, which provides you with
all the moneymaking insights you need to capture trends, trade with the
flow, and pull in profits, regardless of whether market conditions are
good or bad.
What you’ll learn

- reviews: 6
- 20.24 USD
- www.amazon.com
Trading Price Action Trading Ranges : Al Brooks
Divided into five comprehensive parts, Trading Price Action Trading
Ranges skillfully addresses how to spot and profit from trading
ranges—which most markets are in, most of the time—using the technical
analysis of price action. Along the way, it touches on some of the most
essential aspects of this approach, including:
- Trading breakouts, which are transitions from trading ranges to trends, and understanding the gaps they create
- The two types of "Magnets," Support and Resistance, and what they mean once the market breaks out and begins its move
- Pullbacks, which are transitions from trends to trading ranges
- The characteristics commonly found in trading ranges—areas of largely sideways price activity—and examples of how to trade them
-
Honing your order and trade management skills so that you can make more informed entry and exit decisions
And much more
Throughout the book, Brooks focuses primarily on 5 minute candle
charts—all of which are created with TradeStation—to illustrate basic
principles, but also discusses daily and weekly charts. And since he
trades more than just E-mini S&P 500 futures, Brooks also details
how price action can be used as the basis for trading stocks, forex,
Treasury Note futures, and options. For your convenience, a companion
website, which can be found atwiley.com/go/tradingtrends, contains all
of the charts provided in the book.
=============
Check the other book from this series : Trading Price Action Reversals : Al Brooks
The Sensible Guide to Forex: Safer, Smarter Ways to Survive and Prosper
from the Start is written for the risk averse, mainstream retail
investor or trader seeking a more effective way to tap forex markets to
improve returns and hedge currency risk. As the most widely held
currencies are being devalued, they're taking your portfolio down with
them—unless you're prepared.
For traders, the book focuses on reducing the high risk, complexity, and time demands normally associated with forex trading.
For long-term investors, it concentrates on how to hedge currency risk
by diversifying portfolios into the strongest currencies for lower risk
and higher capital gains and income.
The usual forex materials don't provide practical answers for most
retail traders or longer term investors. Virtually all forex trading
materials focus on time-consuming, high-leverage, high-risk methods at
which most traders fail. Materials about long-term investing in foreign
assets rarely take into account the prospects of the related currency. A
falling currency can turn an otherwise good investment into a bad one.
Throughout the book, the emphasis is on planning and executing only low
risk, high potential yield trades or investments and avoiding serious
losses at all costs. Packed with richly illustrated examples every step
of the way and including additional appendices and references to online
resources, the book is the ultimate guide to forex for retail traders
and investors seeking to tap forex markets for better currency
diversification and income.
Provides traders with safer, smarter, less complex and
time-consuming ways to trade forex with higher odds of success. These
include the use of such increasingly popular new instruments like forex
binary options and social trading accounts that mimic expert traders.
Shows investors how to identify the currencies most likely to hold
or increase their value, and provides a wealth of ideas about how to
apply that knowledge to a long-term, low-maintenance portfolio for both
income and capital appreciation.
Helps anyone seeking an asset class with low correlation to other
markets by explaining how the very nature of forex markets means that
regardless of market conditions there's always a playable trend
somewhere, regardless of what other asset markets are doing, and how to
find and exploit it for a short-term trade or a long-term investment in a
currency pair, stock, bond, or other asset
The Sensible Guide to Forex is only book that teaches mainstream risk
averse investors and traders how to build a portfolio that’s diversified
by currency exposure as well as by asset class and sector, via a
variety of safer, simpler methods to suit different needs, risk
tolerances, and levels of expertise.
Written by Cliff Wachtel, a 30+ year financial market writer, advisor,
and analyst, The Sensible Guide to Forex offers practical solutions to
the above dilemmas faced by every serious, prudent investor.
Millionaire Traders: How Everyday People Are Beating Wall Street at Its Own Game
Through interviews with twelve ordinary individuals who have worked hard to transform themselves into extraordinary traders, Millionaire Traders reveals how you can beat Wall Street at its own game.Filled with in-depth insights and practical advice, this book introduces you to a dozen successful traders-some who focus on equities, others who deal in futures or foreign exchange-and examines the paths they've taken to capture considerable profits.
With this book as your guide, you'll quickly become familiar with a variety of strategies that can be used to make money in today's financial markets. Those that will help you achieve this goal include:
- Tyrone Ball: trades Nasdaq stocks almost exclusively, and his ability to change with the times has enabled him to prosper during some of the most treacherous market environments in recent history.
- AShkan Bolour: one of the earliest entrants into the retail forex market, he trades in the direction of the major trend, rather than trying to find reversals.
- Frank Law: a technician at heart, identifies a trading zone, commits to it, and scales down as long as the zone holds.
- Paul Willette: has mastered a method that allows him to harvest some profits right away, while ensuring that he can still benefit from an occasional extension run in his favor.
===============
Other books by Kathy Lien :
- The Little Book of Currency Trading: How to Make Big Profits in the World of Forex (Little Books. Big Profits)
- Day Trading and Swing Trading the Currency Market: Technical and Fundamental Strategies to Profit from Market Moves
===============

- Free trading apps
- Over 8,000 signals for copying
- Economic news for exploring financial markets
You agree to website policy and terms of use
This is the thread about books related for stocks, forex, financial market and economics. Please make a post about books with possible cover image, short description and official link to buy (amazon for example).
Posts without books' presentation, without official link to buy and with refferal links will be deleted.Posts with links to unofficial resellers will be deleted.