USD/CAD, good buy today?
- Indicators with alerts/signal
- CatFx50
- My million-dollar forecasts
Hedge funds are facing fresh scrutiny after Warren Buffett said at his annual meeting Saturday that investors can often do better by avoiding the fees and sticking with bets that track the S&P 500 index. Hunt said in the interview that stocks have become less attractive after so many fixed-income investors switched to equities because they were frustrated with low yields on the safest bonds.
Hi I'm also trading usd/cad and I have some questions. What indicator are you using? Is this a trend following system? Can I use this for other currency pairs? The another question is that is it a non repaint indicator or painted indicator. I have seen this kind of indicator but they don't work in sideways market.
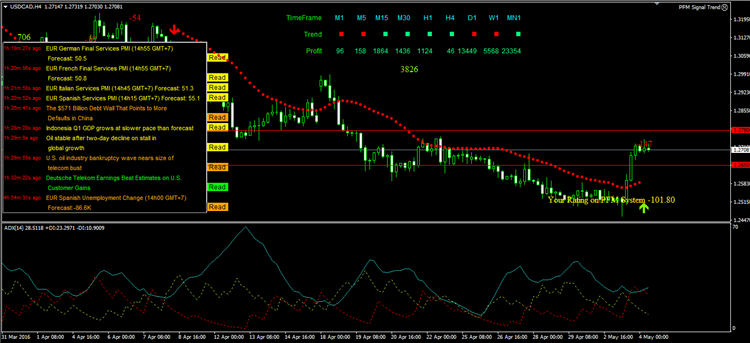
I am using an indicator called PFM Signal Trend. Yes it is a trend following system. It's quite easy, you just need to observe the arrow: when the green arrow appears, there is an uptrend; when the red arrow appears, there is a downtrend. You can use it for different currencies and on multiple time frames.
The indicator is a non repaint one. With the sideways market, you can choose another timeframe with a clearer trend.
Here I will give you the tool so you can experience it yourself and see if this indicator suit your trading style
http://pfmfund.com/signal-trend-free-en.html
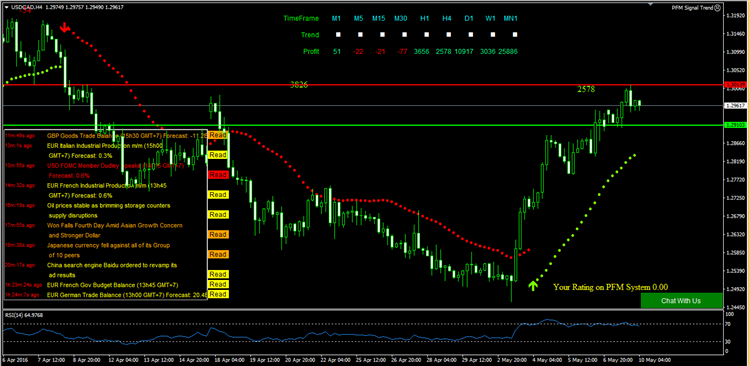
Yes, the pair is still on the rise despite recent dip. Let's enter a long position now
,
- Free trading apps
- Over 8,000 signals for copying
- Economic news for exploring financial markets
You agree to website policy and terms of use