Can one help me in converting this afl to mt4
mLaden, Mrtools,NewDigital are the experts here for coding
new digital,,, well... i dont think he will answer here...
Hi...i am new in the system... do anyone knows about KPL swing (breakout trading system)...can anyone convert this afl into mt4...
//---- heikin ashi
HaClose = (O+H+L+C)/4;
HaOpen = AMA( Ref( HaClose, -1 ), .40);
HaHigh = Max( H, Max( HaClose, HaOpen ) );
HaLow = Min( L, Min( HaClose, HaOpen ) );
xDiff = (HaHigh - Halow) * IIf(StrFind(Name(),"JPY"),100,10000);
barcolor = IIf(HaClose >= HaOpen,colorGreen,colorRed);
PlotOHLC( HaOpen, HaHigh, HaLow, HaClose, "", barcolor, styleCandle );
// Plot(EMA(HaClose,9),"",colorWhite, styleLine);
// Plot(EMA(HaClose,18),"",colorBlack, styleLine);
_SECTION_BEGIN("KPL Swing");
//Copyright Kamalesh Langote. Email:kpl@vfmdirect.com. More details at KPL Swing (breakout trading system)
//Save indicator as "kplswing.afl" in C: program files > Amibroker > Formulas > Custom folder and then drap and drop on price chart
no=Param( "Swing", 20, 1, 55 );
tsl_col=ParamColor( "Color", colorCycle );
res=HHV(H,no);
sup=LLV(L,no);
avd=IIf(C>Ref(res,-1),1,IIf(C<Ref(sup,-1),-1,0));
avn=ValueWhen(avd!=0,avd,1);
tsl=IIf(avn==1,sup,res);
Plot(tsl, _DEFAULT_NAME(), tsl_col, styleStaircase); // or styleaArea
Buy=Cross(C,tsl);
Sell=Cross(tsl,C);
shape=Buy*shapeUpArrow + Sell*shapeDownArrow;
PlotShapes(shape,IIf(Buy,tsl_col,tsl_col),0,IIf(Bu y,Low,High));
_SECTION_END();
That should be a simple high low swing indicator with breaks for highest and lowest signaled as trading signals (at least the second part of the code)
The first part is a regular ema of Heiken ashi close (a lot of metatrader 4 versions around that can do that - check the ones using the set of 20 price types - they all can do that)
hi EVERY ONE in this forum
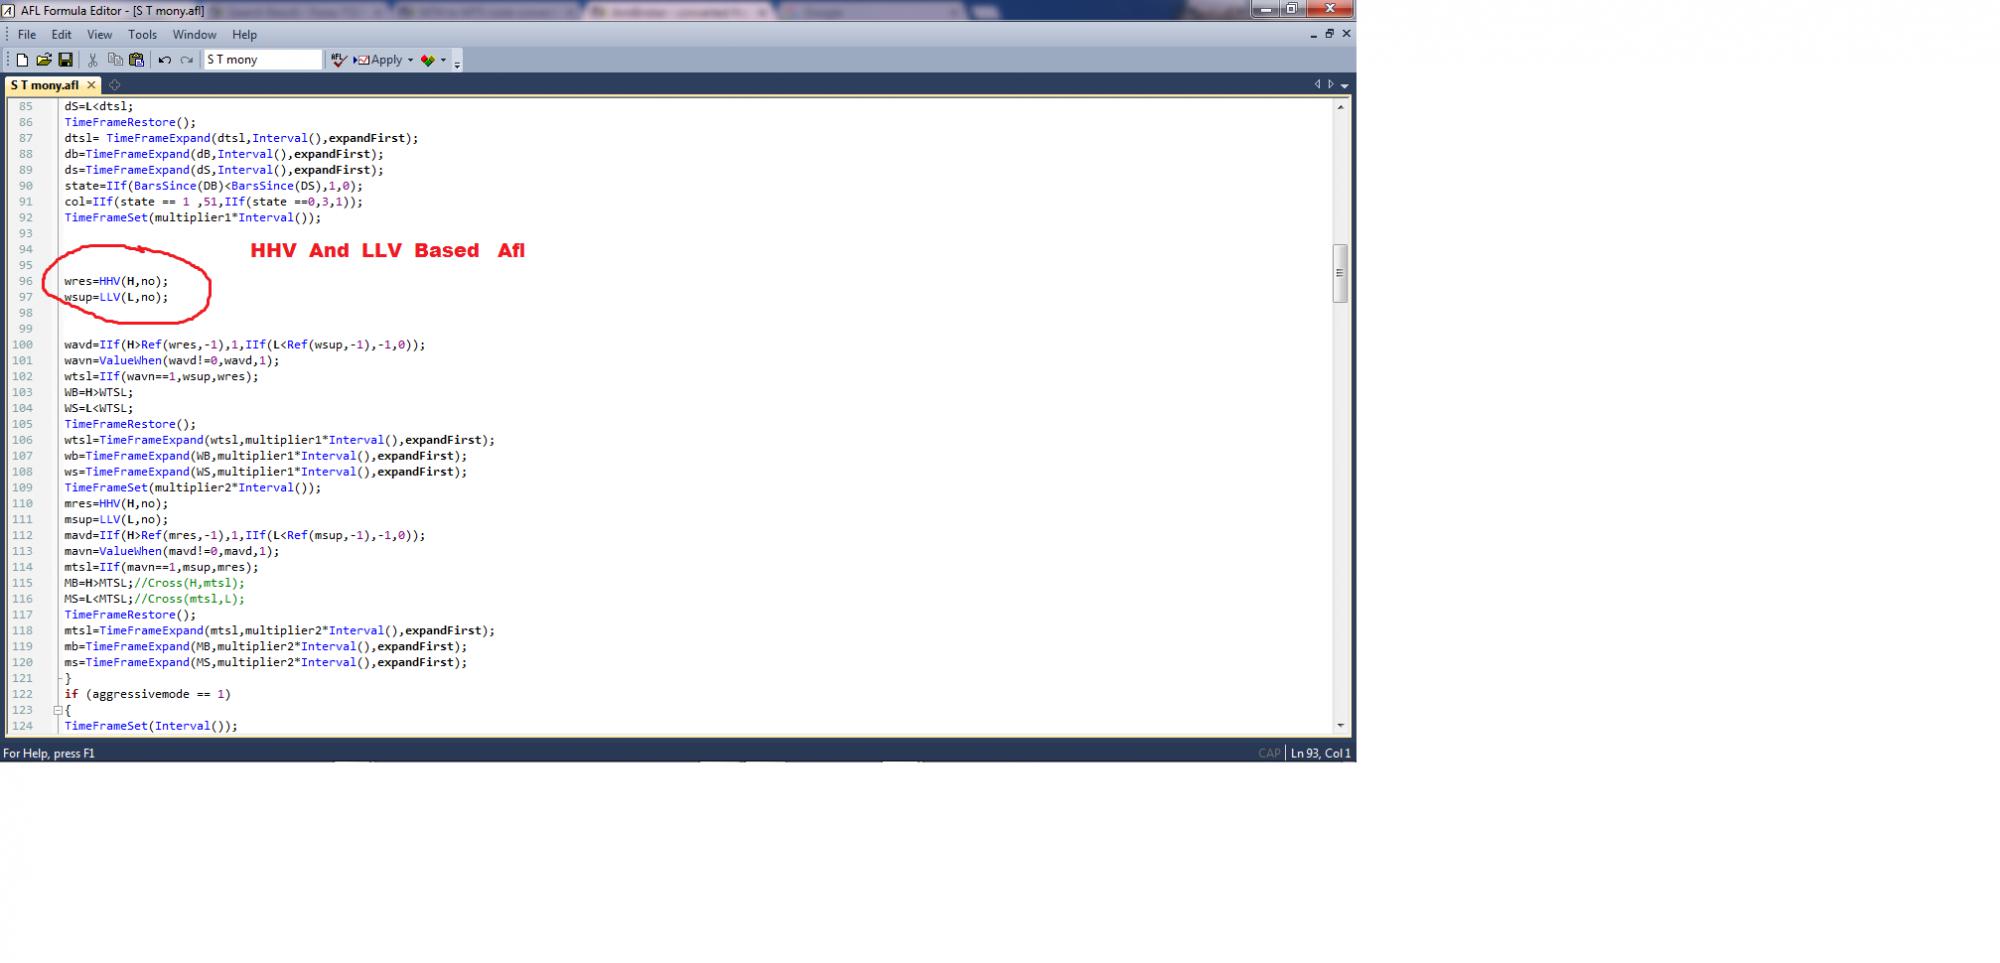
sir i have HHV and LLV based Amibroker Afl sir i search lot of MT4 indicators for have any like this , and finally not found please if possible convert this in to mt4 mql4 ,
this is very helpful me when i trading must watch every time both and ami and mt4 if , sir you convert this in to mt4 very releafe me from both watching ...........and just continue with mt4
................
in this
Afl use internally short and cover systen and we remoove that short cover then it shows like compleate trend in same colour buy or sell only
Buy=ExRem(Buy,Short);
sell=ExRem(Cover,Buy);
mony
That is simple highest high and lowest low for the past "no": bars. A lot of metatrader indicators do that already
sir please .........please its my humble reqest sujjest me any one or more sir ...........i search lot of indicators buy i cant find i search just indicator names but i dont know inside formula so i am not success ...............so sir please ...........
Please read my previous post
There are literally dozens and dozens of such indicators for metatrader. Use any of those
Please read my previous post
There are literally dozens and dozens of such indicators for metatrader. Use any of those
- Free trading apps
- Over 8,000 signals for copying
- Economic news for exploring financial markets
You agree to website policy and terms of use
Hi...i am new in the system... do anyone knows about KPL swing (breakout trading system)...can anyone convert this afl into mt4...
//---- heikin ashi
HaClose = (O+H+L+C)/4;
HaOpen = AMA( Ref( HaClose, -1 ), .40);
HaHigh = Max( H, Max( HaClose, HaOpen ) );
HaLow = Min( L, Min( HaClose, HaOpen ) );
xDiff = (HaHigh - Halow) * IIf(StrFind(Name(),"JPY"),100,10000);
barcolor = IIf(HaClose >= HaOpen,colorGreen,colorRed);
PlotOHLC( HaOpen, HaHigh, HaLow, HaClose, "", barcolor, styleCandle );
// Plot(EMA(HaClose,9),"",colorWhite, styleLine);
// Plot(EMA(HaClose,18),"",colorBlack, styleLine);
_SECTION_BEGIN("KPL Swing");
//Copyright Kamalesh Langote. Email:kpl@vfmdirect.com. More details at KPL Swing (breakout trading system)
//Save indicator as "kplswing.afl" in C: program files > Amibroker > Formulas > Custom folder and then drap and drop on price chart
no=Param( "Swing", 20, 1, 55 );
tsl_col=ParamColor( "Color", colorCycle );
res=HHV(H,no);
sup=LLV(L,no);
avd=IIf(C>Ref(res,-1),1,IIf(C<Ref(sup,-1),-1,0));
avn=ValueWhen(avd!=0,avd,1);
tsl=IIf(avn==1,sup,res);
Plot(tsl, _DEFAULT_NAME(), tsl_col, styleStaircase); // or styleaArea
Buy=Cross(C,tsl);
Sell=Cross(tsl,C);
shape=Buy*shapeUpArrow + Sell*shapeDownArrow;
PlotShapes(shape,IIf(Buy,tsl_col,tsl_col),0,IIf(Bu y,Low,High));
_SECTION_END();