A look from relativity window to Correction and Impulsive waves..
Hello all,
I think it is a bright idea but there is no reply it is strange..Anyway is it possible to create and indicator based on zigzag with this idea?I mean i saw some kind of zigzag which show how many bars and how many pips each legs has at the top or the bottom of peaks and valleys..Is it possible to code something like that but instead of pips it should show how many standard deviation bands has been touched by price?Adjustable bollinger bands settings with for example 2,5 deviation bands also period of single moving average,etc..It clearly has a value i think..Hope i am clear enough..
BENEFITS
*Indicator will add extra confirmation to regular abcd pattern
*Also in some cases it explains sudden trend changes early than regular abcd pattern(might be usefull for picking top/bottom)
Thnx in advance and take care..
Hello all,
I think it is a bright idea but there is no reply it is strange..Anyway is it possible to create and indicator based on zigzag with this idea?I mean i saw some kind of zigzag which show how many bars and how many pips each legs has at the top or the bottom of peaks and valleys..Is it possible to code something like that but instead of pips it should show how many standard deviation bands has been touched by price?Adjustable bollinger bands settings with for example 2,5 deviation bands also period of single moving average,etc..It clearly has a value i think..Hope i am clear enough..
BENEFITS
*Indicator will add extra confirmation to regular abcd pattern
*Also in some cases it explains sudden trend changes early than regular abcd pattern(might be useful for picking top/bottom) Thnx in advance and take care..Hi qualm01,
You might want to look at the Harmonic Analysis thread and for Gartley Patterns...
They look like your "waves"...and I think there are a few EA's here on Forex-TSD that are already made to work with those wave patterns.
Hopefully the EA's may be easily modified for your needs...
Hope this helps,
Robert
Thnx for the advice Robert but i have a bias to harmonic analysis in a bad way
 without any experience with harmonic analysis i just think it doesn t work..I did not use it also i use that abcd image to explain what i try to mean..There is no relationship between harmonics and this idea...For me ABCD pattern is a continuation pattern in trend trading but vice versa in harmonics(i guess)..Anyway thnx again.. Take care and have a plenty of pips
Hi Qualm01,
Not necessarily suggesting that you learn Harmonic analysis (I don't know it either)...
But it did sound like you wanted to codify your system into an EA...?
Consider this a suggestion to look at the EA's that use ZUP's and Gartley's...
And you can use them to change the formula's and strategies to your Wave Continuation pattern...?
Just thinking aloud...hope it helps,
Robert
Thnx for the advice Robert but i have a bias to harmonic analysis in a bad way without any experience with harmonic analysis i just think it doesn t work..I did not use it also i use that abcd image to explain what i try to mean..There is no relationship between harmonics and this idea...Just abot two waves one impulsive the other one is corrective that's it..For me ABCD pattern is a contuniation pattern in trend trading but vice versa in harmonics(i guess)..Anyway thnx again..
Edit:I said there is no relationship with harmonics and this idea but i think a harmonic trader also can use this idea for extra confirmation..
Not sure if it is a proper gartley pattern but here is an example how to use this idea for extra confirmation if you use harmonic pattern to trade..According to gartley we should sell at D and according to my idea we should not think about buying at D just beacuse C-D is longer(in terms of pips) than B-C.I guess we can call it reverse confirmation 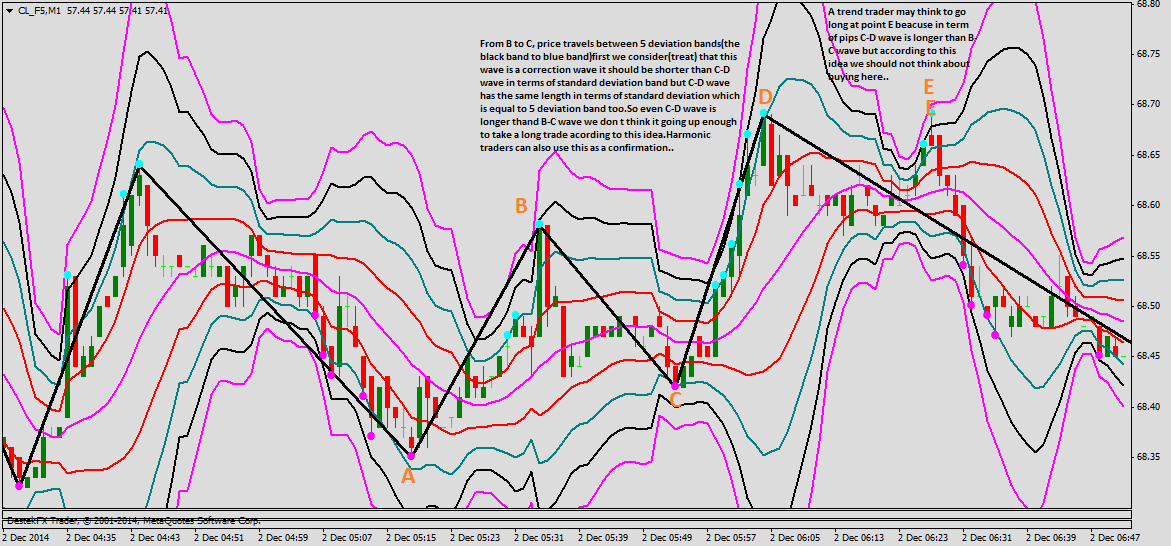
Hope i am clear enough...
Take care and have a plenty of pips
Actually no need for an EA if it can be done as an indicator..Beacuse it has simple logic behind it but bright one..I think coders don t look at that threads under ideas and suggestion forum..So maybe i try to find at Harmonic thread..Thnx again Robert..
Take care and have plenty of pips.
- Free trading apps
- Over 8,000 signals for copying
- Economic news for exploring financial markets
You agree to website policy and terms of use
Hello all,
Hope everything is fine..Here is my little contrubution to forex-tsd...It sounds so smart i know but it is a simple idea..I don t know much about relativity theory but i guess i did not pick it entirely wrong as a thread's name..Anyway the idea is simple yet effective..Hopefully with your contribitions we can improve this idea..
There is a way to explain market with waves..Seasoned traders would already know it..So according to this idea market move with waves and there is 2 waves which called;Correction and impulsive...Impulsive wave is the wave that we take it for defining trends and correction wave is stand for corrections in trends..Another simple definition would be like this:I hope u heard ABCD pattern so in this formation there is 3 wave one is starting from A to B the other is starting from B to C and the last one starting from C to D...In these wave a wave which we called impulsive waves are one from A to B and the other is C to D...The correction wave is starting from B to C..The only one difference between these waves is their length..Impulsive wave should be longer than the correction wave(but here is a little tricky beacuse sometimes impulsive wave change to corrective also correction wave to impulsive)..I think we can easily called this pattern as an atom of markets..
My idea is help us to decide when each waves may turn eachother' form..I mean an impulsive wave change to correction wave or vice versa...
I use for this good old Bollinger bands indicator..As some of you already know bollinger band is one moving average with two standard deviation bands of that moving average..I plot 4 bollinger bands with same moving average but different standard deviations band so in theory price is now box in those bands it should not pass the borders of 4 standard deviation..Now after i apply from 1 to 4 standard deviation bands i measure those waves length not by in terms of pips but in terms of standard deviation bands..I mean from a bottom to a potential top i don t care length in terms of pips i look the price if it passed deviation bands or not..So for example the length of wave maybe longer(in terms of pips) than the other but it only travels between 3 deviation bands but on the other hand short wave(in terms of pips) travel from the lowest 4 deviation band to upper 4 deviation band that means the shorter(in terms of pips) wave is longer(impulsive) than the other long wave(in terms of pips)..
Here is two examples from Oil...One with regular 1 min timeframe the other one is with range bar
I never saw this on any forums.On the other hand it needs imporvment such as bollinger bands with half deviations etc..
Hope i am clear enough..Sorry about my english..I like to hear your opinions about it..
Take care and have a plenty of pips