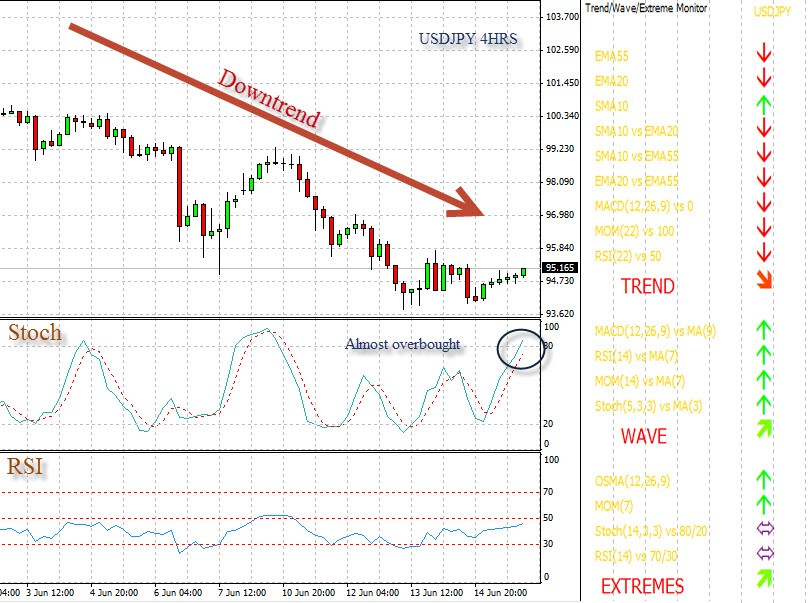
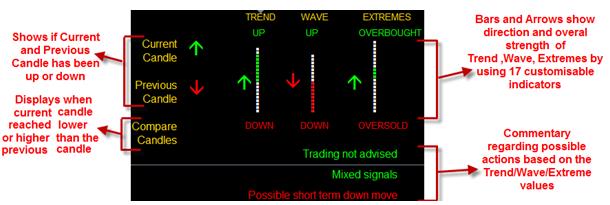
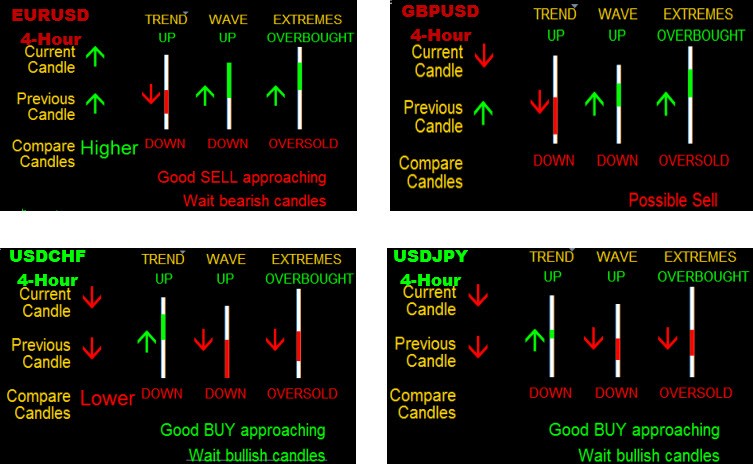
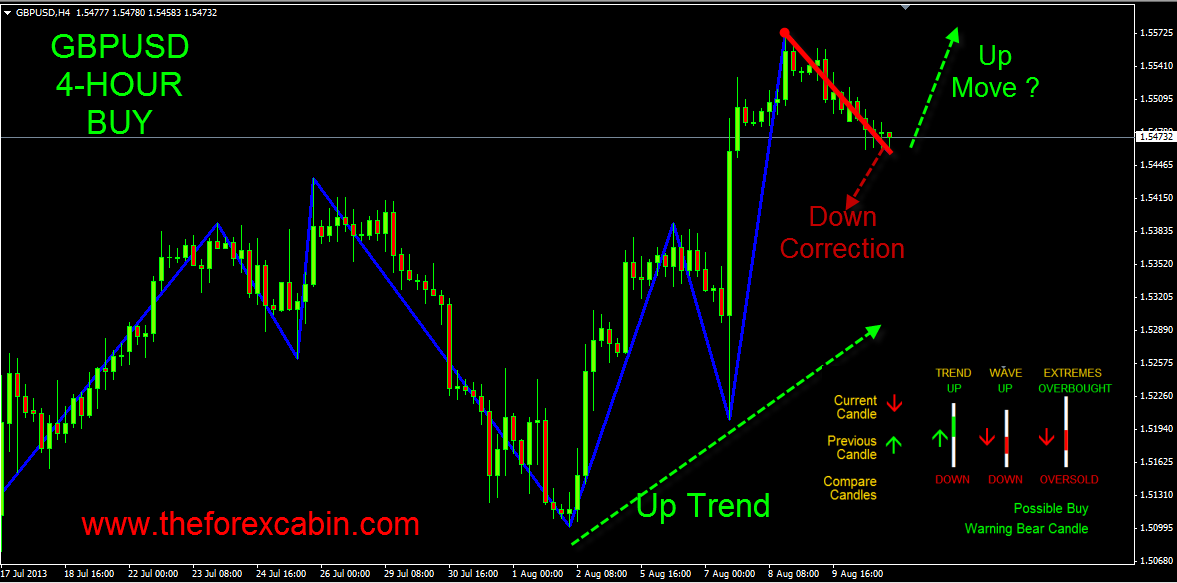
Trend/Wave/Extreme Analysis
Buying the oil
Buying the Oil.
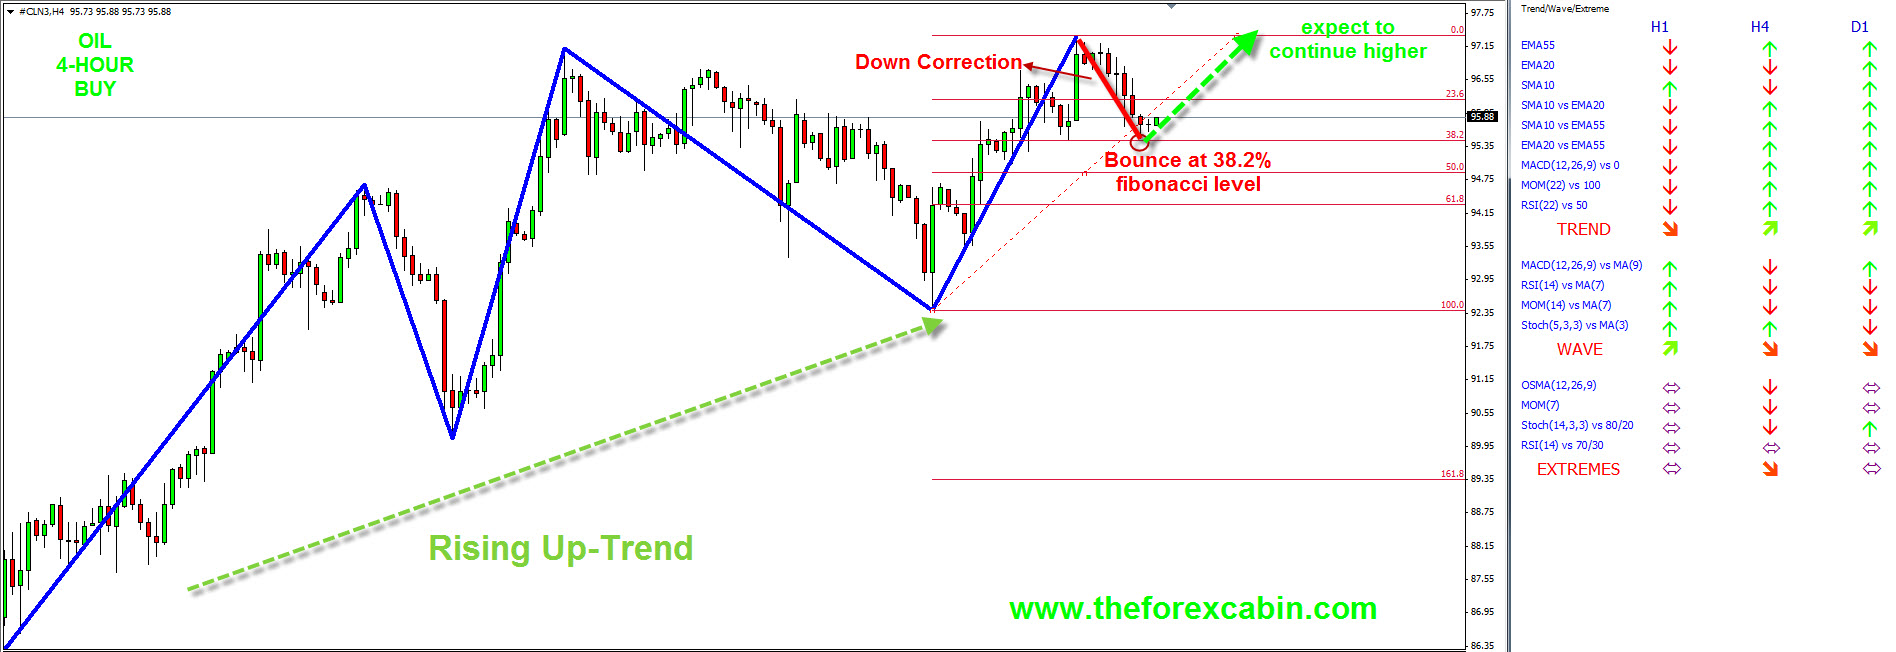
The rise in Oil stockpiles brought the value of Oil lower continuing its decline over the past couple of days. With the overall trend however being up it’s an opportunity to get in this and buy oil.
Oil (4-Hour) Buy
Why Buy
- A strong up trend line formation
- Trend (long term) indicators are pointing up for both the 4-Hour and Daily timeframe
- Wave (short term) indicators for 4-H and Daily point down being consistent with the trend under 1-H (a shorter timeframe)
- Extreme indicators under 4-Hour point oversold while neutral under 1-Hour and daily
- Support was found and bounce occurred after the 38.2% Fibonacci retracement level
Read more about today's analysis here, and about the Trend/Wave/Extreme system where this analysis is based on here.
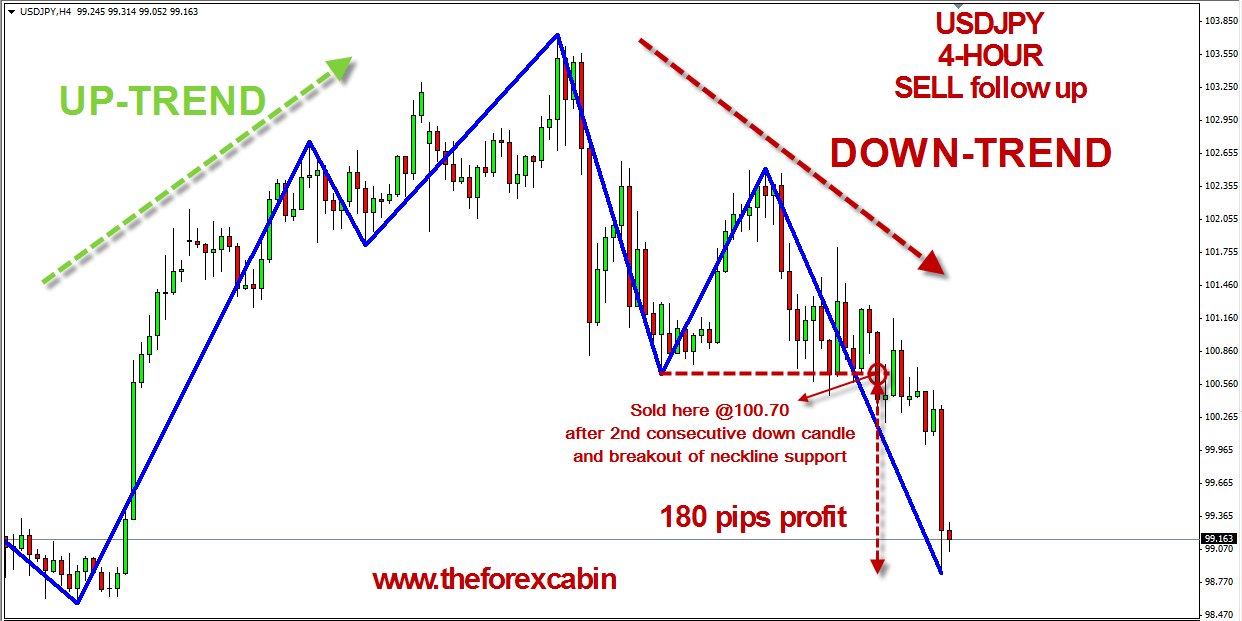
We were quick to spot a head and shoulder pattern being formed on the USDJPY . Hence we are selling.
Trend/Wave/Extreme system is showing that all the Long and Short Term indicators are pointing Up , while none of them Oversold.
More here
On Friday (31.05.2013) we pointed a sell trade on USDJPY following a head and shoulders formation.
Check out herehow this trade made us 180 pips and about the Trend/Wave/Extreme system where this analysis is based on here.
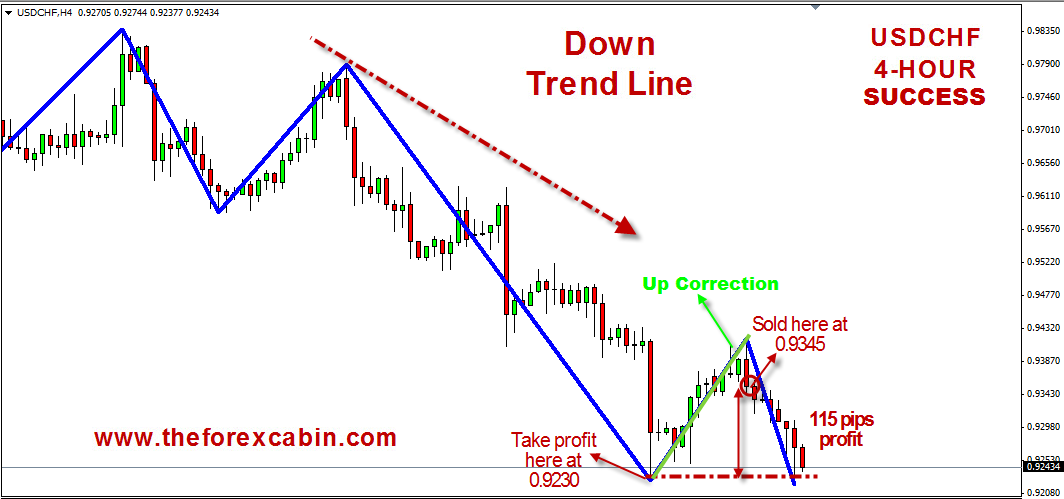
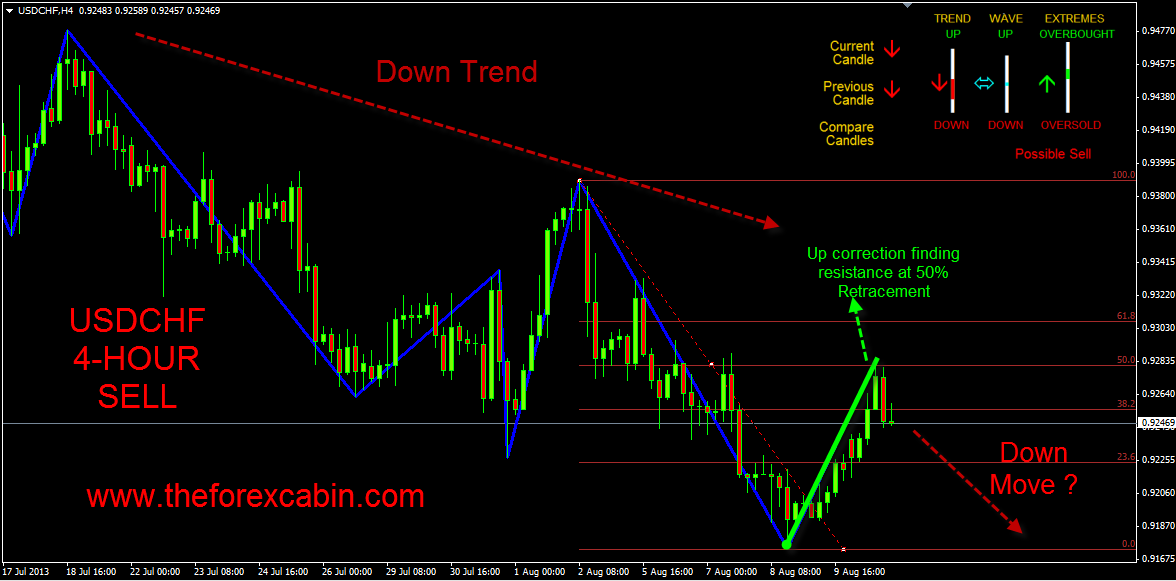
USDCF(4-HOUR) SELL
Why sell
A continuous down trend line
Trend (long term) and Wave (short term) indicators are all pointing down
None of the Extreme indicators are pointing oversold
Two consecutive down candles formed
Read more about today's analysis here, and about the Trend/Wave/Extreme system where this analysis is based on here.
And yes we keep on making money .
Check herehow our last trade to Sell USDCHF made 115 pips quick.
Read about the Trend/Wave/Extreme system here.
Get your FREE copy of the indicator here.
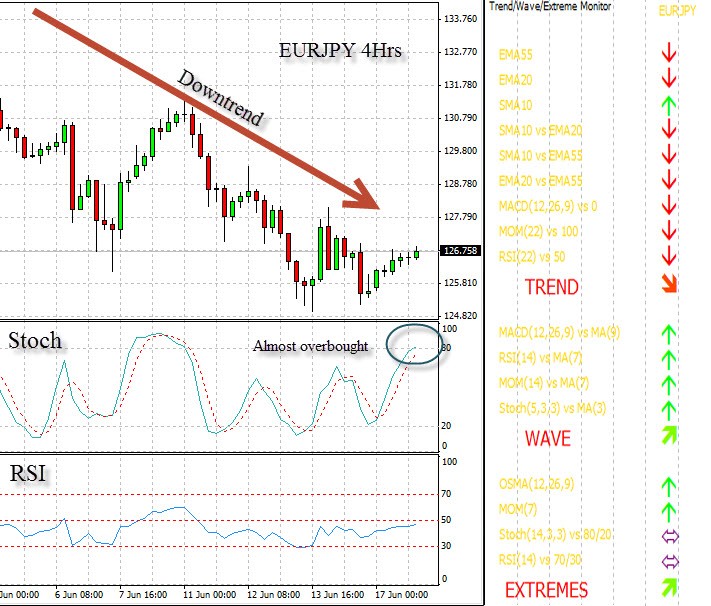
Selling USDJPY/EURJPY
Why sell
- A down trend line being apparent
- Trend (long term) are pointing down
- Extreme Indicators are pointing overbought
Read more about today's analysis here, and about the Trend/Wave/Extreme system where this analysis is based on here.
USD oversold after Federal Reserves Minutes (10.07.2013)
USD has reached oversold region against many currencies making it a good buy opportunity.
Read more about today's analysis here, and about the Trend/Wave/Extreme system where this analysis is based on here.
Shorting the USD for over 100 pips
An opportunity to short USD through EURUSD ,GBPUSD,USDCHF
Read more about today's analysis here, and about theTrend/Wave/Extreme system where this analysis is based on here.
- Free trading apps
- Over 8,000 signals for copying
- Economic news for exploring financial markets
You agree to website policy and terms of use
Time to buy the US Dollar again 21/05/2013
The US Dollar has been gaining consistently over the previous week against nearly every currency in the board. Yesterday we the saw however the US Dollar pulling back a bit. Possibly some people who were long the USD decided to take their profits. What does this mean for you as a trader ? It is time to buy USD again.
NZDUSD/AUDUSD (4-HOUR) Sell
Why Sell
•A strong downtrend line
•Trend (long term indicators) are pointing down
•One extreme indicators pointing overbought
•Chart pattern shows a bounce has occurred after an upwards correction.
Read more about today's analysis here, and about the Trend/Wave/Extreme system where this analysis is based on here.