Price Channel Difference
picture would be a good demonstration of your description 
thank you
Thank you so much......
burn0050:
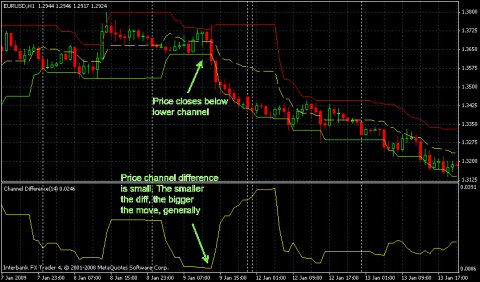
I wrote this indicator to show the difference of a price channel. A price channel is the highest high and lowest low for a time period.
I wrote this indicator to show the difference of a price channel. A price channel is the highest high and lowest low for a time period.
The idea behind this indicator is that when the difference gets smaller, the higher the chance for a breakout to one side or the other. Also, the smaller the difference, the bigger the move will possibly be.
I use this also as a confirmation. You can look at how long the price channel has been the same or gotten smaller.
first i will thanks to u.
should U can share the indicator for the chart windows?
...
Check this thread : https://www.mql5.com/en/forum/173179
If I understand correctly, you can find it (the price channel itself) in that thread
rhinomax:
first i will thanks to u. should U can share the indicator for the chart windows?
first i will thanks to u. should U can share the indicator for the chart windows?
You are missing trading opportunities:
- Free trading apps
- Over 8,000 signals for copying
- Economic news for exploring financial markets
Registration
Log in
You agree to website policy and terms of use
If you do not have an account, please register
I wrote this indicator to show the difference of a price channel. A price channel is the highest high and lowest low for a time period.
The idea behind this indicator is that when the difference gets smaller, the higher the chance for a breakout to one side or the other. Also, the smaller the difference, the bigger the move will possibly be.
I use this also as a confirmation. You can look at how long the price channel has been the same or gotten smaller.