No Brainer Trades - trade naked!
Level 4 today!
(anyone not familiar with how to use these please read through the materials in our trading strategy section)
CHF has buys at 1.1560, 1.1500, 1.1470, 1.1375 sells at 1.1785, 1.1893
EUR has sells at 1.3000, 1.3080. 1.3140, buys at 1.2680, 1.2460
GBP has sells at 1.6385, 1.6500, 1.6650, 1.6725, buys at 1.5850 (50% of monthly wave), 1.5610
JPY has buys at 99.25, 98.60, 97.90, sells at 100.85, 101.33, 102.15
Amazing!!
I was keeping track of eur/usd and it hit the levels perfectly before retracing. I went through the (quite elaborate) post but still dont quite understand how to come up with those levels. When I cycle through from the larger timeframe to the the smaller timeframe to "guess" the support and resistance levels, I have way too many levels to be useful. Can you please elaborate on your method for getting these levels; what to keep, what to throw out. Thanks!
I do exactly the whole drawing method at S&R, and those congestions area are the places to trade. The hard part is to figure out which side to be on.
But I've already said that multiple times, but people just doesn't seem very interested in it.
So Inzider, how do you choose which side to be on? What type of price action are looking for? There is a lot of fake breakout to run stops and fake resistance to draw in the traders....then boom.
And people have the tendency to draw too thin a line, and they expect the market to not cross it. To me, they are more zones, not lines.
Hi guys!
I'm more then happy that some of you get interrested over this simple and logic tech. Honnestly, "indic" give me headic.
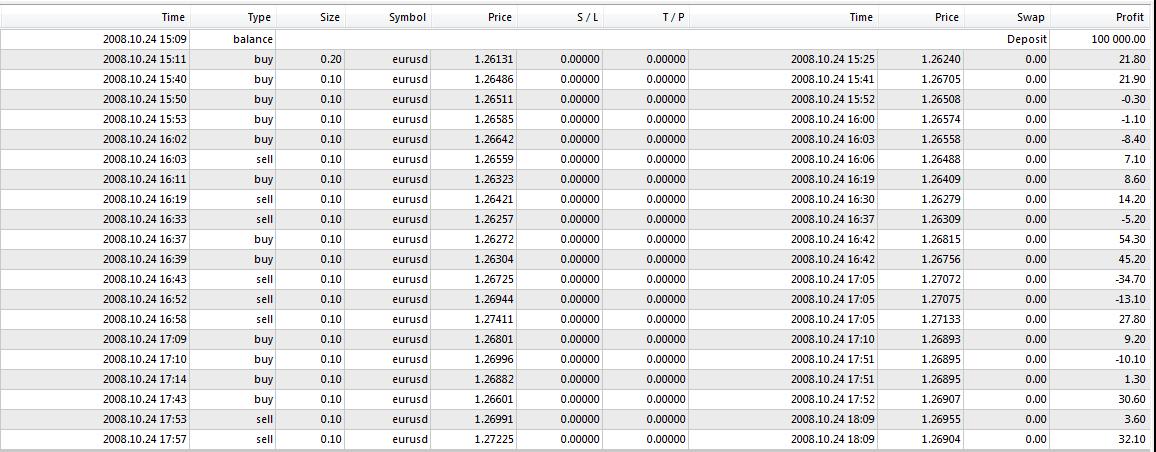
I'll elaborate on chossing support and on witch side place trade in my next post for now i would like to show you some umble result for this morning:
-1$/pips, 200$ in 2h 30 min, easy morning ... low risk = stress less, great result in short time...
Keep in mind i'm no master at all. Just trading as you all, learning is never end process...
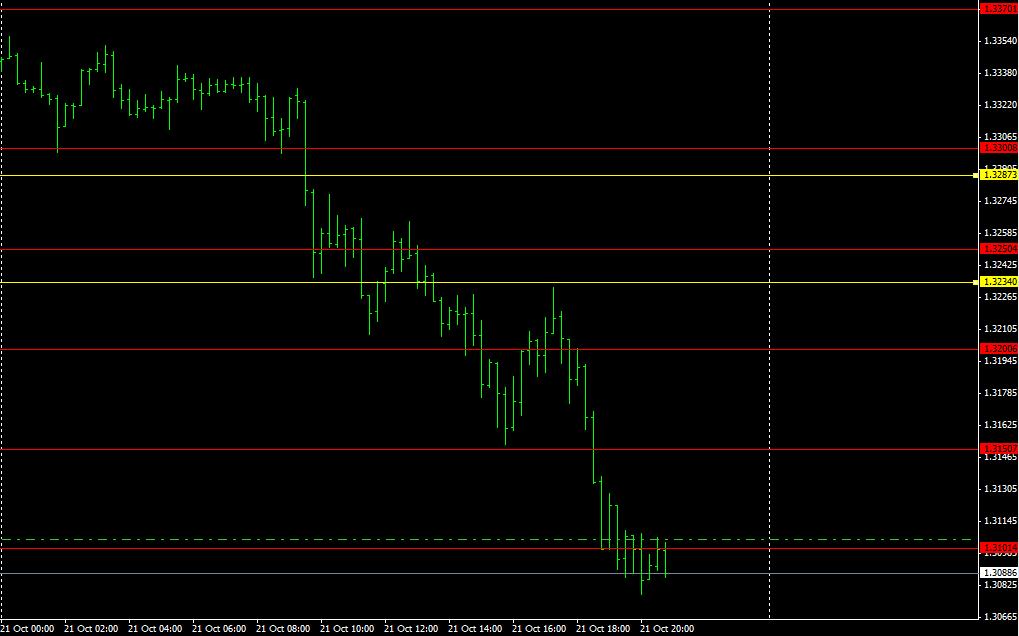
Eur/USd
Obvious short @ 1.27.47
1 Target 1.2681
2 Target 1.2642
kenny,
Before coming across this thread, I used daily pivot points (which kinda sorta works). And the way I handle which side to take was dependent on where the current price was. If the current price was below the "zone", one of two things could happen: 1) it could go up and bounce off the resistance zone or 2) it could completely break through. I place a buy stop order 5 pips above the pivot line (with 80 tp, 40 sl); That takes case 1. My only solution for case 2 is to wait, and wait and wait until the price is at the target level. At that point if it just staggers there or bounce back, I'll place a sell stop order (or just enter short) 5 pips away from the pivot line with the same sl and tp. Some days though, there are lots of fake-outs, like you said, and I just have to stop trading rather than risk doing something foolish.
very nice! low stress, low risk, nice profit. i love it!! 
To keep it simple, all you need to find is area where price had good S or R.
Look back at historic to find those.
You are searching point where price as been use as a S and a R, making double U shape pattern.
Ajust ur line while scrolling down into chart time frame.
-----------------------------------------
For lower time frame then 1h, i use the 00-50-25 number, multiple last waves tops and bottoms, price pattern/action - double top, head sholder, doji, hanging man, bullish/bearish harami or engulfing bar and look for next one for direction.
I also use 8 Ema, 50 EMA and 200EMA . Those react perfectly.
-----------------------------
On a 1 min chart, if you wait for price making a double top then close under 50Ema and built on, after first test at 50 ema in the middle of the double top, and let say near a important level, its a 90% accuracy trade.
5 min chart will be use for larger price pattern and better look at trend. 15 min is also really good.
For the target, we can use fibos. 50% of last swing or 76%.
-------------------------------
Trend line aren't that good, my opinion is that you are better looking at last wave top and bottom to find if price is builting on those wave, or fading into. Double top will fade until last swing high,... When this point is broken, trend is .... broken. That make you an exact price, instead of guessing with a trend line.
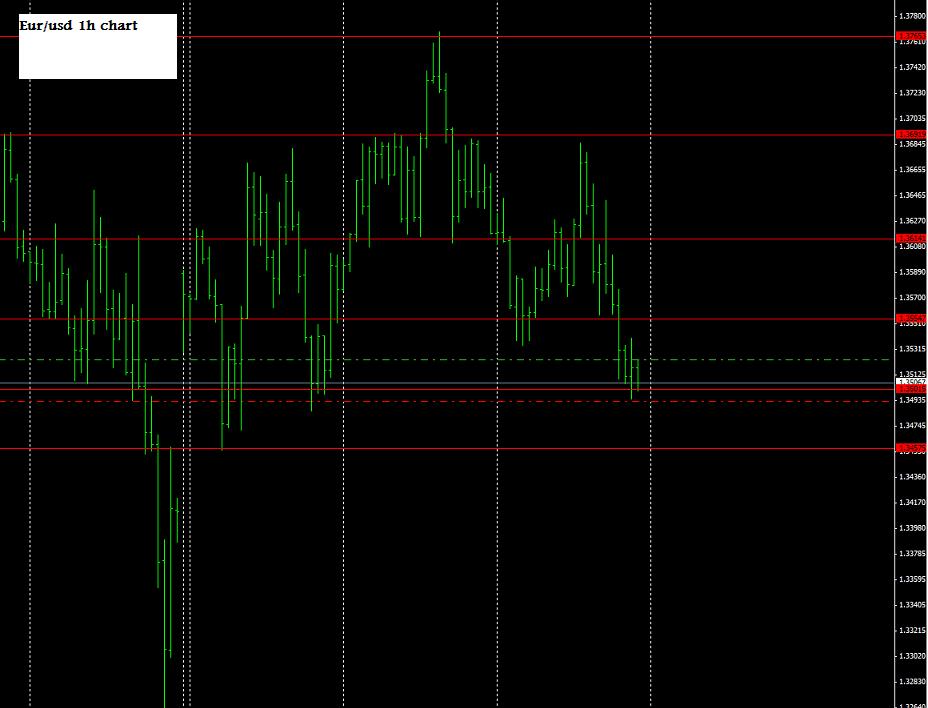
Have a look over those chart, we ll developpe on question:Thanks for the example. That was really helpful.
1-Suggestion: look back into historic to see what reaction price had at that point. If price is makinf a ascending triangle in a up trend, forget the fade.
2-Price will sometimes fade into a level witch not mean its a breakout, some large swing can make a 20 pips fade drawdown before being profitable.
3-When price get at a important point, the most important is price action. You should have instant reaction to those if not its planning a breakout. Those are only test one or 2 times, giving you chance to get out if you haven't make the good 50/50 choice. Doji, Harami, Enfulging bar are ints. After a doji or etc, look at next bar direction.
4-And lets not forget that its a risky business, and also the most important point: a probability game! Yes a game... Because no one can predict next tick, of someone have followed your idea: short or long the thing.
So you need to trade good probability setup, as high TF S&R. Then your chance of being on the good side is increasing since all traders around teh world can say: "Hum, let's short that thing!" whit you being in front.
--------------
Enough blabla for me, have a look at those audio from Mark Douglas: "Trading in the zone" who developpe on the head frame, the good psychology to adopt when trading.
Hope it helps!
Inz
Forex Factory - View Single Post - Trading In The Zone
---------------------------
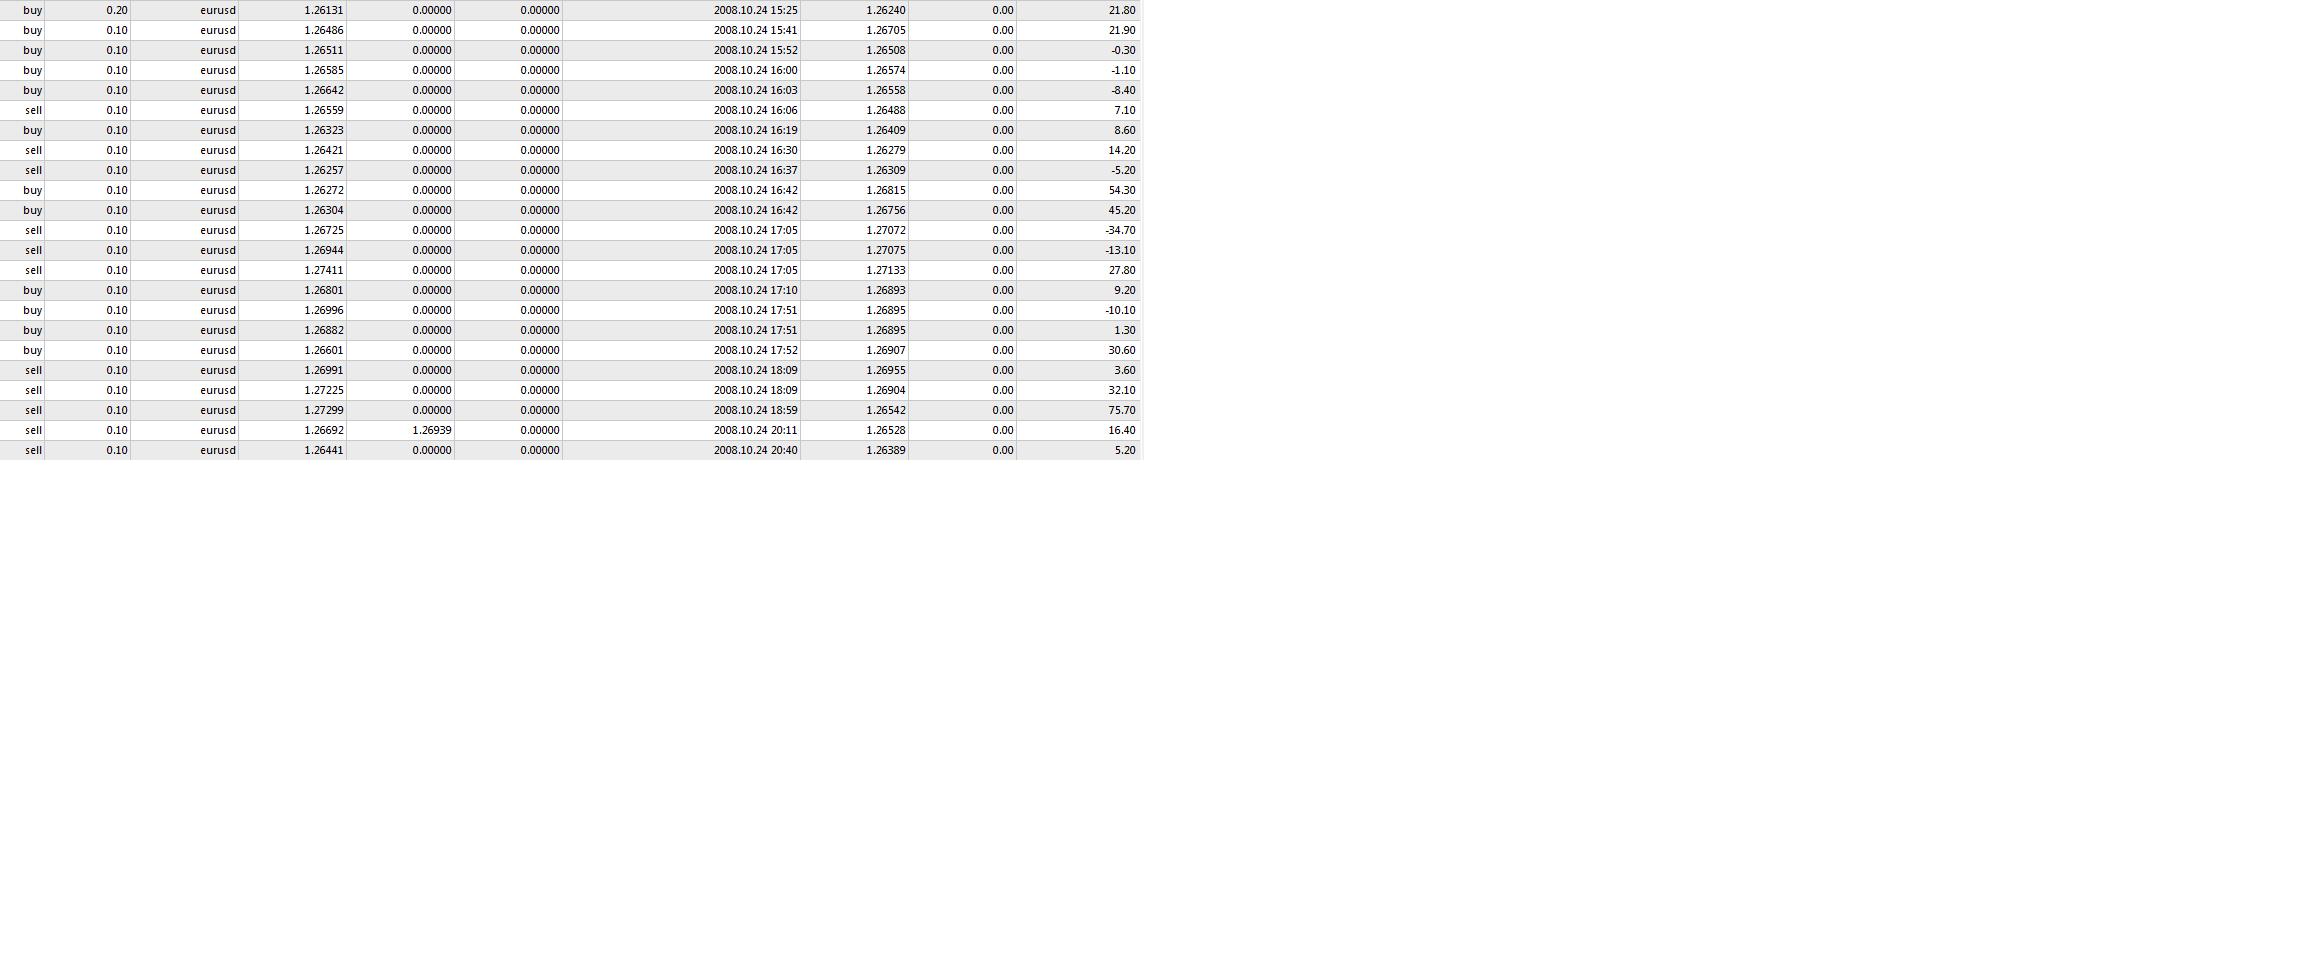
300 pips day.... 1$ per pips.... low risk, stress.... less!
I'm out for today, have a nice week-end!
- Free trading apps
- Over 8,000 signals for copying
- Economic news for exploring financial markets
You agree to website policy and terms of use
Hi all!
I bet some of you know the concept about S and R, hehe... and also the "system" i will talk about : No Brainer Trades from BillyRayValentine (BRV) on ForexFactory!
The full thing is presented on FF but i felt, into the madness of indicators over here, that it would be usefull for some to have a second if not a first look over this technic.
What is the no brainer trades method means:
1-Get a monthly chart, and trace a S/R line at L/H and pivot.
2-Do the same over W, 4H, 1H chart.
3-Look at 15 min chart for price action/pattern and be aware about 00-50 number and 50/61/76%fibs retracment of last swing.
Your Fix!!!!
-----------------------
Look what price will do at those S/R pivot.
Most of the time you can fade those whit a nice returns.
I won't go in details here because FF got a nice post about it, but i'll leave the PDF explaining the full thing and also the link of the thread.
We could talk about this here, just a suggestion.
Good trade all!!!!
(40 trades - average +131.60 pips per trade)
5/14/2008 USD/CAD 0.9986 Long Max Drawdown (pips) -16 Max Pips +80
5/14/2008 AUD/USD 0.929 Long Max Drawdown (pips) 0 Max Pips +250
5/14/2008 EUR/JPY 162.9 Short Max Drawdown (pips) -4 Max Pips +164
5/16/2008 AUD/USD 0.9471 Short Max Drawdown (pips) -4 Max Pips +30
5/16/2008 AUD/USD 0.95 Short Max Drawdown (pips) -18 Max Pips +20
5/16/2008 USD/JPY 104.04 Long Max Drawdown (pips) -1 Max Pips +21
5/18/2008 NZD/USD 0.7745 Short Max Drawdown (pips) -3 Max Pips +39
5/19/2008 USD/CAD 0.993 Long Max Drawdown (pips) -4 Max Pips +19
5/21/2008 EUR/USD 1.5685 Short Max Drawdown (pips) 0 Max Pips +55
5/22/2008 USD/JPY 102.74 Long Max Drawdown (pips) -1 Max Pips +250
5/22/2008 AUD/USD 0.9648 Short Max Drawdown (pips) -5 Max Pips +250
5/27/2008 EUR/JPY 164.8 Short Max Drawdown (pips) -8 Max Pips +169
5/29/2008 EUR/USD 1.5632 Long Max Drawdown (pips) -23 Max Pips +37
5/29/2008 USD/CHF 1.0424 Short Max Drawdown (pips) 0 Max Pips +65
5/29/2008 EUR/USD 1.5547 Long Max Drawdown (pips) -2 Max Pips +41
5/29/2008 USD/JPY 1.0437 Long Max Drawdown (pips) -8 Max Pips +15
6/4/2008 USD/JPY 104.66 Long Max Drawdown (pips) -12 Max Pips +176
6/4/2008 EUR/USD 1.548 Short Max Drawdown (pips) -3 Max Pips +96
6/5/2008 EUR/USD 1.5365 Long Max Drawdown (pips) -2 Max Pips +250
6/5/2008 USD/CHF 1.017 Long Max Drawdown (pips) -23 Max Pips +250
6/9/2008 EUR/USD 1.584 Short Max Drawdown (pips) -1 Max Pips +250
6/10/2008 EUR/USD 1.5484 Long Max Drawdown (pips) -1 Max Pips +51
*7/7/2008 USD/JPY 107.73 Short Max Drawdown (pips) -2 Max Pips +250
7/8/2008 USD/JPY 106.42 Long Max Drawdown (pips) -17 Max Pips +123
7/8/2008 AUD/USD 0.9501 Long Max Drawdown (pips) -25 Max Pips +250
7/15/2008 EUR/USD 1.6000 Short Max Drawdown (pips) -37 Max Pips +250
7/15/2008 USD/CHF 1.0021 Long Max Drawdown (pips) -10 Max Pips +250
7/16/2008 GBP/USD 1.9960 Long Max Drawdown (pips) -1 Max Pips +112
7/16/2008 EUR/USD 1.5800 Long Max Drawdown (pips) -17 Max Pips +143
7/22/2008 USD/CHF 1.0136 Long Max Drawdown (pips) 0 Max Pips +250
7/23/2008 AUD/USD 0.9668 Long Max Drawdown (pips) -1 Max Pips +19
7/23/2008 EUR/JPY 165.95 Short Max Drawdown (pips) 0 Max Pips +250
7/23/2008 USD/CHF 1.0392 Short Max Drawdown (pips) -15 Max Pips +77
7/29/2008 GBP/USD 1.9800 Long Max Drawdown (pips) -39 Max Pips +42
7/31/2008 USD/JPY 108.35 Short Max Drawdown (pips) -3 Max Pips +106
8/04/2008 USD/CAD 1.0319 Short Max Drawdown (pips) -40 Max Pips 0
8/06/2008 USD/CAD 1.0460 Short Max Drawdown (pips) -16 Max Pips +11
8/21/2008 USD/JPY 108.40 Long Max Drawdown (pips) -27 Max Pips +188
8/21/2008 NZD/USD .7216 Short Max Drawdown (pips) -1 Max Pips +250
9/29/2008 USD/CHF 1.1050 Short Max Drawdown (pips) -39 Max Pips +232
9/30/2008 EUR/USD 1.4256 Long Max Drawdown (pips) -19 Max Pips +15
10/6/2008 GBP/USD 1.7430 Long Max Drawdown (pips) -40 Max Pips 0
Thread: No Brainer Trades
Daily Commentary: http://www.nobrainertrades.com/search/label/Commentary