Minmax period indicator
thank you, Mikko
HiLo and Open - really nice
reminder: tf(period):
extern string note_period =
"M1;5,15,30,60H1;240H4;1440D1;10080W1;43200MN|0-CurrentTF";
great indicator
Thank you for your indicator
Could you please add labels to the lines
Hi all,
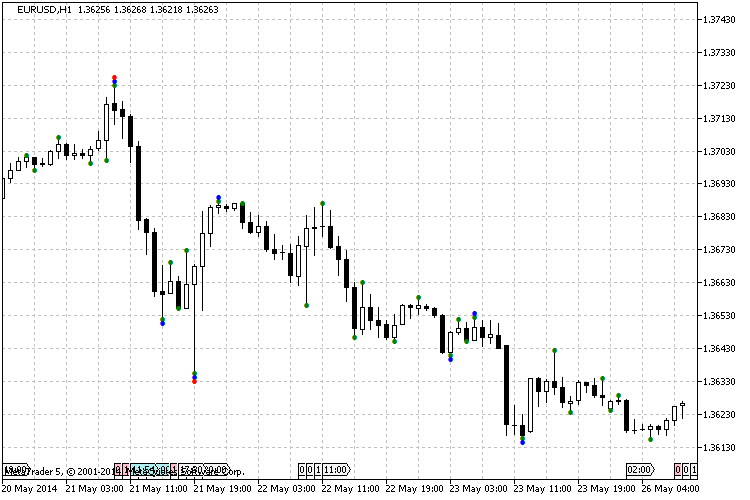
Haven't posted here for a while but here is my latest indicator, one that I actually use in live trading. It's very powerful when looking at price action. In fact the picture you see below is one of the actual templates I use when I trade.
The indicator is used to see period high, low, median and open at the chart.
Period is always one candle of some period, for example at the image below the lines show min/max/median/open of weekly candle. Period can be set from the values so you can project monthly min/max, weekly min/max, daily min/max etc to any chart.
Gray lines are the period minimum and maximum
Red line is median for the period
Blue line is open for the period
It's very important to understand that for example when price crosses monthly/weekly blue line, the monthly candle turns opposite from what it used to be, this has very high psychological impact. Median value and min/max values have same impact. Note how price usually bounces from the lines so it's very important to watch price action when the price is near these lines.
(Yellow lines on the chart are from my other indicator that I use in live trading with 100/100 settings to see the round numbers and filter movement by certain fixed amount of pips, you can find it here https://www.mql5.com/en/forum/178725 - round numbers have important psychological value too)
cheers
- Free trading apps
- Over 8,000 signals for copying
- Economic news for exploring financial markets
You agree to website policy and terms of use
Hi all,
Haven't posted here for a while but here is my latest indicator, one that I actually use in live trading. It's very powerful when looking at price action. In fact the picture you see below is one of the actual templates I use when I trade.
The indicator is used to see period high, low, median and open at the chart.
Period is always one candle of some period, for example at the image below the lines show min/max/median/open of weekly candle. Period can be set from the values so you can project monthly min/max, weekly min/max, daily min/max etc to any chart.
Gray lines are the period minimum and maximum
Red line is median for the period
Blue line is open for the period
It's very important to understand that for example when price crosses monthly/weekly blue line, the monthly candle turns opposite from what it used to be, this has very high psychological impact. Median value and min/max values have same impact. Note how price usually bounces from the lines so it's very important to watch price action when the price is near these lines.
(Yellow lines on the chart are from my other indicator that I use in live trading with 100/100 settings to see the round numbers and filter movement by certain fixed amount of pips, you can find it here https://www.mql5.com/en/forum/178725 - round numbers have important psychological value too)
cheers