In case it has not been noticed
hm...strange...
RSI code:
rel=Close-Close;
if(rel>0) sump=rel;
else sumn=-rel;
positive=(PosBuffer*(RSIPeriod-1)+sump)/RSIPeriod;
negative=(NegBuffer*(RSIPeriod-1)+sumn)/RSIPeriod;
}
PosBuffer=positive;
NegBuffer=negative;
if(negative==0.0) RSIBuffer=0.0;
else RSIBuffer=100.0-100.0/(1+positive/negative);
Hello,
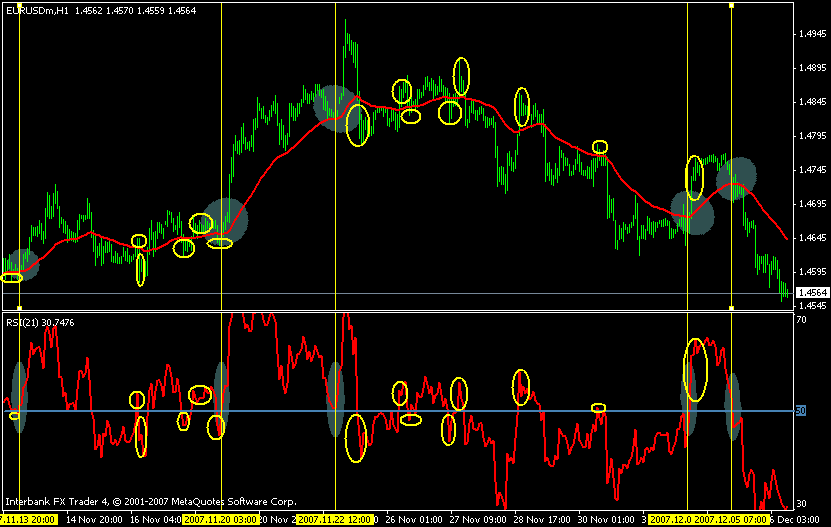
while this looks ok after the fact , what would you do about those
yellow circle false signals that could be easily in question with this chart set up without at least some other confirmation ?
Will ya wait until bar close ?
Also during live feed RSI will swing below and back up or vice versa quite few times in this picture where it touch exactly the 50% line.
If just indicators are that easy 
Sincerely,
ChampionFx
rsi14 rsi34 X50 -- SmMA14 SmMA34X filter
(rsi on open bar dansing - like a very lot  )
)
- Free trading apps
- Over 8,000 signals for copying
- Economic news for exploring financial markets
You agree to website policy and terms of use
Hi!
I am quite newbee into all this. Have been practising FOREX on Demos.Have come to know and understand the indicators and while fiddling around with them, i noticed something.I dont know if it is old stuff.
It can be handy in eliminating having many indicators saying the same thing.
For example price crossing MA21(smoothed) = RSI 21 crossing its 50th level
You can try with other MA(smoothed) and RSI of MA value. It gives the same indications.
You can also try diff Time Frames. It all says the same.
Hope this helps in coding or programming EAs.
See attachment. Have plotted a few examples.
victor