Index of /Forex/BlackBoxes/Kalman (expert)
so.......does this thing do like martingale and stuff?
Hi Gody,
Thanks for sharing the indicator. By the way, how do you use this Kalman indicator? I don't really understand actually  Thanks mate.
Cheers,
Files:
kalmanch.gif
12 kb
By the way, when I download the files, it doesn't seem to be in the right format, so I change it manually. Here are the files, hope you don't mind I post it here
Cheers,
Files:
kalman.rar
18 kb
You need WinRAR to open this up!
I have attached it to this - Had to winzip it to attach it to this post. Unzip using winzip - extract the .exe to desktop or wherever and click on it to get the version of win that opens RAR files up.
Dave
<<<
Files:
rar_winzip_inside.zip
1140 kb
You are missing trading opportunities:
- Free trading apps
- Over 8,000 signals for copying
- Economic news for exploring financial markets
Registration
Log in
You agree to website policy and terms of use
If you do not have an account, please register
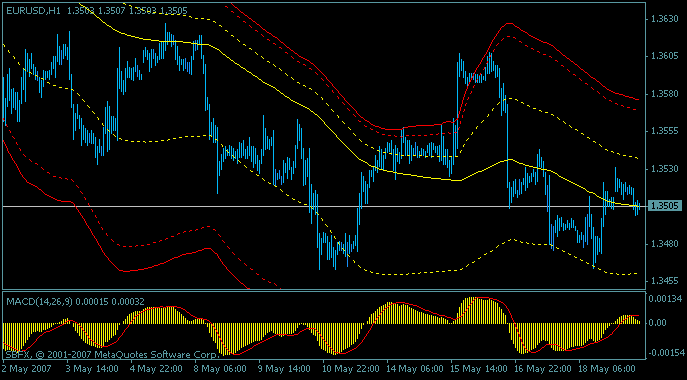
Notes for the Kalman filter with Auto Gain.
How I use this:
I am currently mostly using this tool in a manner similar to Bollinger bands,
using the trendline to determine the strength and direction of the trend,
and the exterior lines as guides for buing and selling.
Samples:
The number of bars you would consider to be enough to provide an estimate
of a coherence/stability on the time frame you are looking at. This depends on the nature
of your trading habits, and the sort of trends - or excursions from trends - you are
looking for.
I find the following useful:
60 for 1 minute bars (= 1 hour)
60 for 5 minute bars (= 5 hours)
24 for for the 15 minute, 30 minute, and 1 hour bars (=6, 12, and 24 hours, respectively)
30 or 60 or so for the 4 hour bars (= 5 or 10 trading days)
21 for the dailies (= 1 average working month)
13,26, or 52 on the weeklies ( one quarter, 1 half, and 1 year)
12 on the monthlies (much longer if you are working JPY crosses).
There is nothing magical about these numbers, they are just what I find convenient for my own
trading style. It is important to find ones suitable to your own, and then stick with them.
Changing the erratically is very bad for your pocket book!
DevLevel1 and DevLevel2:
These determine how many (one-sided) deviations from the trendline to put the edge lines.
1 and two work for me when I run this as an indicator; set these to 0 to suppress
their output.
Suppression_dB:
This works in conjunction with AutoGainOn boolean (true/false) variable. If AutoGainOn
is true, then this number is used as a starting point for estimating the actual suppression.
If AutoGainOn is false, then this value is used as the value for the suppression,
and not changed (i.e., it becomes the simple Kalman filter).
See the note at the end testing the validity of the autogain.
PredictBars 1 and 2:
Set these to non zero if you would like to see predictions PredictBars1 or
PredictBars2 in the future. If you have faith in your weather forcaster, you'll love these.
Otherwise, take them with a large grain of of salt (optimally placed between
your thumb and forefinger, and preceeded with a good shot of tequila...)
PrintCurrentState:
set this to true to print a line to the experts log after each update cycle
detailing the current suppression level in dB,
the value of the trend line at the last point, the speed of the trend in pips/bar,
and the return rate (speed/price) in annualized percent.
AutoGainOn:
Set this to true to turn the AutoGain on. If false, the value of Suppression_dB will
be fixed (and wyou will be running the standard Kalman filter).
********Note on AutoGain Validity*****
In some timeframes and some supplier's data, there is insufficient data for the
AutoGain to reach its optimal level. On data directly from Metatrader,
this is pretty much the case only on the monthlies, but in ay case it's a quick
check that is useful whenever you change time frames.
Make sure AutoGainOn is set to true, and so is PrintCurrentState. set the Suppression_dB
to any value (or leave it at zero).
Run the indicator, and look at the suppression level printed on the experts log. Call up the
indicator properties window, and insert this value into Suprression_dB,
and let the indicator run again. If it is more than half a dB or so away from the value
you set, you will need to find a better starting point. Those familiar with binary searching
can do this by hand in a few steps. For others - if the printed estimated gain is larger than
what you started with, increase it by about 10 dB and repeat. As long as the estimated
version is larger than what you put in, keep increasing the staring point by 10 or 20.
Eventually it should wind up being smaller than what you put in. Use the reported level
as the starting point, and repeat until what yo put in is pretty much what you get
as an estimate. Make a note of that value for the future, and use it as a starting point
if you want to run it later on the same time frame and same pair.
Eventually I'll get this replaced by a simple script to determine the value. In the meantime
you may find certain pathological points (on one minute data) on which the estimation of
the suppression collapses to some very large negative number. This shouldn't happen.
Let me know if it does. Occassionally a pair/timeframe will ehibit more than one
stability point (USDJPY, I think will do this). I use the smallerest reasonable value.
But on the whole the estimates are broadly accurate, and stable. You should expect them to
change slowly as the data changes.
work on your part for now. After you have initialized the indicator, bring up
its interface window from the
AutoGainOn:
// the indicators are currently set up for a 1 hour type chart, to produce
// the trend, 1 deviation on either side, 2 deviations on either side, and 2 deviations
// on either side calculated off the highs and lows.
//
// You will need to put GRFMatrixmath.mq4 in the "libraries" directory, and compile it.
// You will need to put GRFMatrix.mqh in the "include directory.
// This file goes in the "indicators directory, and will need to be compiled.
//
//Input variables:
// Samples sets the
// die off of the exponentially averaged deviations. Bigger numbers give
// smoother edges. 120 (5 days on the hourlies) works pretty well, but feel free to change it. It
// can be set to a non-integer number, but use numbers greater than 2.
//
// DevLevel (1 & 2) - deviation levels - By setting
// the deviation levels to zero, they don't get plotted. Otherwise they m
//
// Suppression_dB sets the level that noise will be suppressed. 0dB is usually appropriate
// 20dB gives the equivalent of long term averages, -20 gives a fast line. The only pairs
// I don't use this setting at 0 on are JPY crosses, in which I usuallly increase the suppression by 6
// dB or so.
//
// PredictBars - gives predictions for the center of trend in bars steps. For hourlies,
// I use 24 and 48. The information is printed on the "Experts" log. This gives
// an expected center and (IIRC) an 95% expected confidence interval. This will be fine tuned later.
//
// PrintCurrentState - if true, print the trend value and the speed of the trend (in pips/bar).
//
// Comments and questions - brobeck@ns.sympatico.ca . I really appreciate feed back. Thanks!
// CB
//
//Notes for the simple Kalman filter.
//
//How I use this:
// the indicators are currently set up for a 1 hour type chart, to produce
// the trend, 1 deviation on either side, 2 deviations on either side, and 2 deviations
// on either side calculated off the highs and lows.
//
//Input variables:
// Samples sets the
// die off of the exponentially averaged deviations. Bigger numbers give
// smoother edges. 120 (5 days on the hourlies) works pretty well, but feel free to change it. It
// can be set to a non-integer number, but use numbers greater than 2.
//
// DevLevel (1 & 2) - deviation levels - By setting
// the deviation levels to zero, they don't get plotted. Otherwise they m
//
// Suppression_dB sets the level that noise will be suppressed. 0dB is usually appropriate
// 20dB gives the equivalent of long term averages, -20 gives a fast line. The only pairs
// I don't use this setting at 0 on are JPY crosses, in which I usuallly increase the suppression by 6
// dB or so.
//
// PredictBars - gives predictions for the center of trend in bars steps. For hourlies,
// I use 24 and 48. The information is printed on the "Experts" log. This gives
// an expected center and (IIRC) an 95% expected confidence interval. This will be fine tuned later.
//
// PrintCurrentState - if true, print the trend value and the speed of the trend (in pips/bar).
//
// Comments and questions - brobeck@ns.sympatico.ca . I really appreciate feed back. Thanks!
// CB
//
http://www.gammarat.com/Forex/BlackBoxes/Kalman/