Corrected Moving average
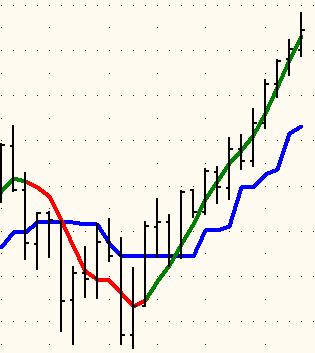
Chart example
Here's a chart example.
I'm not intentionally indicating the market or the time frame for showing the indicator capability to stay with a strong trend.
Hope that someone can program it in Metatrader.
ps: In this chart, this is not a sma but a Hull ma which served as a trigger.
Files:
cma.jpg
18 kb
raff1410:
Hi...
Hi...
Try this one...
RaffHi Raff your work is always awwesome.
Can you please put 2 colors on this indicator, like sloping upgreenand sloping downred
thanks a lot 
Cma
Hi...
Try this one...
Raff
Very nice work RAFF
Thanks again

Have someone can help with this indicator?
I need to have the possibility to draw the sma...or not...
Thanks
Here's Tradestation Code:
{Corrected Average (CA), A.Uhl, Oct. 25, 2005}
vars:
CA(0),SA(0),n(0),
v1(0),v2(0),K(0);
inputs:
Price(Close),length(35);
if CurrentBar=1 then
CA=Price
else
begin
if CurrentBar<length then
n=CurrentBar
else
n=length;
SA=Average(Price,n);
v1=Square(StdDev(Price,n));
v2=Square(CA[1]-SA);
if v2<v1 then
K=0
else
K=1-v1/v2;
CA=CA[1]+K*(SA-CA[1]);
end;
Plot1(CA,"Correct Avg",Red,White,3);
Plot2(SA,"Simple Avg",Blue,White,1);