Corrected Moving average
Chart example
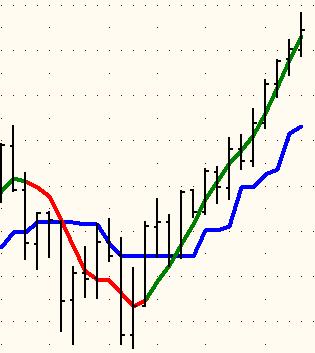
Here's a chart example.
I'm not intentionally indicating the market or the time frame for showing the indicator capability to stay with a strong trend.
Hope that someone can program it in Metatrader.
ps: In this chart, this is not a sma but a Hull ma which served as a trigger.
Files:
cma.jpg
18 kb
raff1410:
Hi...
Hi...
Try this one...
RaffHi Raff your work is always awwesome.
Can you please put 2 colors on this indicator, like sloping upgreenand sloping downred
thanks a lot 
Cma
Hi...
Try this one...
Raff
Very nice work RAFF
Thanks again
You are missing trading opportunities:
- Free trading apps
- Over 8,000 signals for copying
- Economic news for exploring financial markets
Registration
Log in
You agree to website policy and terms of use
If you do not have an account, please register
Have someone can help with this indicator?
I need to have the possibility to draw the sma...or not...
Thanks
Here's Tradestation Code:
{Corrected Average (CA), A.Uhl, Oct. 25, 2005}
vars:
CA(0),SA(0),n(0),
v1(0),v2(0),K(0);
inputs:
Price(Close),length(35);
if CurrentBar=1 then
CA=Price
else
begin
if CurrentBar<length then
n=CurrentBar
else
n=length;
SA=Average(Price,n);
v1=Square(StdDev(Price,n));
v2=Square(CA[1]-SA);
if v2<v1 then
K=0
else
K=1-v1/v2;
CA=CA[1]+K*(SA-CA[1]);
end;
Plot1(CA,"Correct Avg",Red,White,3);
Plot2(SA,"Simple Avg",Blue,White,1);