Fibonancy with pation
learning how working with fibonancy and support resistance
ready to be rich...
Forum on trading, automated trading systems and testing trading strategies
Fadlillah Al Farisyi, 2016.11.08 13:33
learning how working with fibonancy and support resistancebecause we all want to learn too
:)
Forum on trading, automated trading systems and testing trading strategies
Something Interesting in Financial Video March 2014
Sergey Golubev, 2014.03.26 11:37
Fibonacci... it's a technical tool that can make you richYou may have heard about Fibonacci, the man who discovered a set of numbers who that have a major affect on the market. So who is this Fibonacci fellow, and why are his findings so important in the market place?
The mathematical findings by this thirteenth century Italian man has yielded a useful technical analysis tool which is used in technical analysis and by scientists in a large array of fields. Born Leonardo of Piza, he is better known in the trading community as Fibonacci. Fibonacci's best known work is Liber Abaci which is generally credited as having introduced the Arabic number system which we use today.
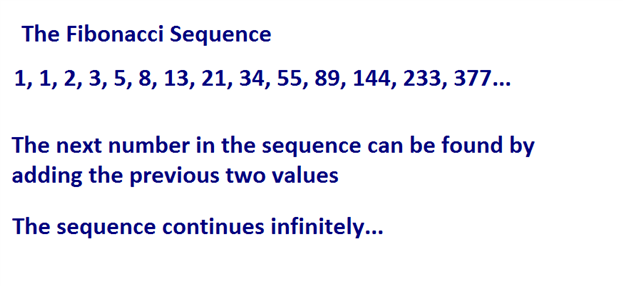
Fibonacci introduced a number sequence in Liber Abaci which is said to be a reflection of human nature. The series is as follows: 1, 1, 2, 3, 5, 8, 13, 21, 34, 55, 89, 144 and on to infinity. The series is derived by adding each number to the previous. For example, 1+1=2 , 2+1=3, 3+2=5, 5+3=8, 8+5=13, and so on.
Fibonacci retracements show where support and resistance might come into the market. It is also useed to enter or add onto a position.
Can you please post all the indicators by source codes and explain about how to trade this system?
because we all want to learn too
:)
ok sergey my brother....
i have no indicator modification, thats all just standar indicator that mt4 have. just MA 5 and 10 and bolinger band 20.... the fibonancy we take the point from the candlestick that break the support or resisteance to the highgest or lower tail of the candle. happy to share...
Forum on trading, automated trading systems and testing trading strategies
Something Interesting in Financial Video January 2014
Sergey Golubev, 2014.01.04 07:21
Lesson 1 -- Fibonacci Number Sequence
The Fibonacci Sequence is most likely the most influential series of
numbers in the world. It is also likely that you encounter the numerical
pattern everyday. This mathematical series was discovered by Leonardo
Fibonacci of Pisa in the early thirteenth century and was outlined in
his book, Book of Calculations. 1, 1, 2, 5, 8, 13, 21, 34, 55, etc. are
the "golden" numbers that are found in geometry, art, anatomy, music,
biology, botany, conchology, and even trading. After the two starting
values, each following number is the sum of the two proceeding numbers.
Fn=Fn-1 + Fn-2
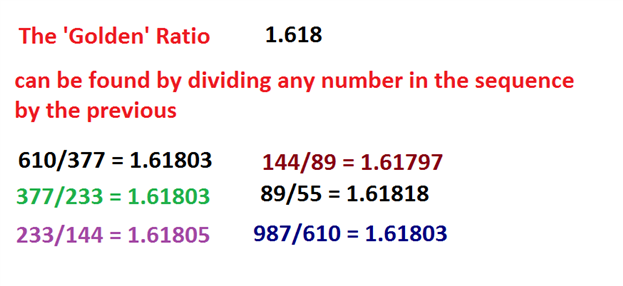
How does this relate to trading? The ratio of any
number to the next larger number of the sequence is 62% (or specifically
61.8%), the "Golden" ratio. The inverse of that Fibonacci ratio is 38%
(or specifically 38.2%). Mathematical psychologist, Vladimir Lefebvre
suggested that traders exhibit positive and negative evaluations of the
opinions they hold about the market. These negative and positive
evaluations have direct correlation with the retracement percentage seen
in market analysis.
If you are interested the Fibonacci Sequence you may also want to obtain more information on Elliot Wave and W. D. Gann.
Forum on trading, automated trading systems and testing trading strategies
Sergey Golubev, 2014.06.13 07:43
The Rabbit Hole of Fibonacci (adapted from this article)- We look at the history and background of the mathematical concept known as ‘The Fibonacci Sequence’
- We show you how traders can apply these mathematical studies to their trading.
Fibonacci
This is one of the more in-depth support and resistance methods out there, and there are a lot of different ways that traders look to integrate Fibonacci in their trading.
Taking a step back, Fibonacci is named after the 12th century mathematician, Leonardo of Pisa. In 1202 AD, Leonardo published a composition with the name of Liber Abaci that consisted of a numerical sequence that eventually became named after him. Leonardo of Pisa didn’t discover the sequence; he merely used it as an example in his composition.
The sequence is thought to have been originally used by Indian mathematicians as early as the 6th century; and in Liber Abaci, this numerical sequence was introduced the western world. The sequence introduced by Leonardo of Pisa was a system that found the next value in the sequence by adding the two previous numbers. The sequence shared in Liber Abaci was as follows:
Today these values are called ‘Fibonacci numbers’ and are used by many traders as input values for indicators along with a slew of other purposes.
But input values on trading indicators aren’t the only place that we’ll see this system at work. The Fibonacci sequence has excited mathematicians and scientists for thousands of years because of its numerous applications in the world around us. One of the initial applications that Leonardo of Pisa investigated in his original manuscript was the population growth of rabbits. He found that as an isolated population of rabbits grew, the population would grow according the Fibonacci sequence. Starting with one pair of rabbits, the population would then grow to two; which would become three, and then five, eight, thirteen, etc. The sequence is also prominent in population growth within honeybees, the number of petals on a flower, and the formation of pine cones just to name a few.
Many believe the Fibonacci sequence to be the language of nature itself. If you want to see more on this topic, Fibonacci was prominently featured as part of the movie Pi; the fictional movie released in 1998 that follows a mathematician’s quest in predicting the future based on mathematics. But even outside of fictional movies, the numerous manners with which the sequence appears in the world around us is fascinating and definitely worthy of a google-search.
But that’s not the only exciting aspect of the Fibonacci sequence. More fascinating is what we can see if we look just a little bit below the surface. If you take the ratio of any two successive numbers, such as 144 and 233 and divide the second number (233) by the first (144), you’ll eventually move towards a very special number of 1.618 (61.8%). In this specific example, the exact value would be ‘1.6180555…’ The deeper we get in the sequence, the closer this ratio moves towards 1.618 until eventually the ratio stands at exactly 1.618. This number is the prize behind Fibonacci, and it has fascinated mathematicians and scientists for thousands of years.
The number of 1.618 is called ‘The Golden Ratio,’ and can be found in numerous applications within nature ranging from the spirals of a sea shell to leaf arrangements of a houseplant.
Trading with Fibonacci (and the Golden Ratio)
Traders will often employ Fibonacci when looking to trade retracements in a trend, centering support and resistance levels around intervals defined by the Golden Ratio of 1.618.
The center of Fibonacci analysis is at the .618 interval of the trend, taken directly from the golden ratio. But we can take this a step further by dividing a number in the sequence by the number located two figures to further. If we take 34 and divide that number by 89; or if we take 133 and divide that by 377, we consistently receive values of ~.382 (38.2%). This is the next value that traders will plot via Fibonacci analysis.
We can then do the same thing with by dividing any number in the sequence with the digit located two places further. So, for example, if we divide 34 by 144; or if we divide 55 by 233, we consistently receive values of ~.236 (23.6%). Traders have taken this a step further to examine the mid-line of the move (.50, or 50%), and .786 (78.6% - or the reciprocal of .236). The finished result is what we have below using the weekly GBPUSD chart:
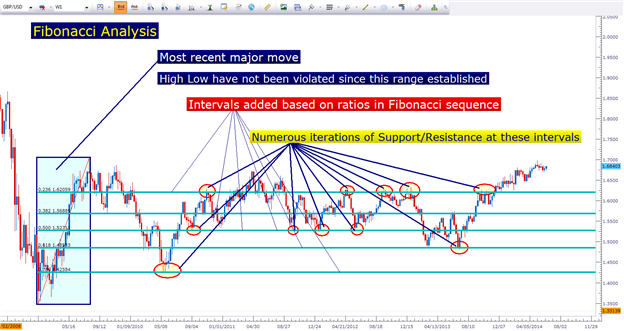
As you can see in the above chart, these price levels on a chart can exhibit phenomenal examples of support and/or resistance coming in the market place. And luckily for us, using Fibonacci as a trader is significantly easier than proving any ‘magical’ components behind it as mathematicians have attempted to do for the past couple thousand years.
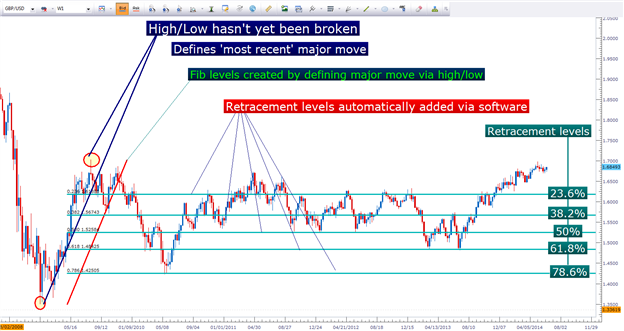
To use Fibonacci, a trader needs to merely identify a most recent ‘major move.’ This is where subjectivity comes in to play. This major move can be on the 5-minute chart, the hourly chart, or the weekly chart (as we had done with GBPUSD above). But like we saw with Pivot Points, longer-terms and more data generally brings more value to the analysis simply because more traders may be seeing it. If we draw a Fibonacci retracement on a 5-minute chart; it might be seen by a few other traders whereas a retracement taken from the weekly chart will likely generate more interest from traders simply because it encapsulates significantly more data.
Traders can use the Fibonacci tool available in most trading platforms to define the move, and then levels at the proper intervals of .236, .382, .500, .618, and .786 can be drawn in. So, when prices move down to the .236 line, we can say that 23.6% of that trend has been retraced. Or if prices move down the .618 level, 61.8% of the trend has been re-traced.
Forum on trading, automated trading systems and testing trading strategies
Indicators: Fibonacci retracement
Sergey Golubev, 2014.01.31 11:05
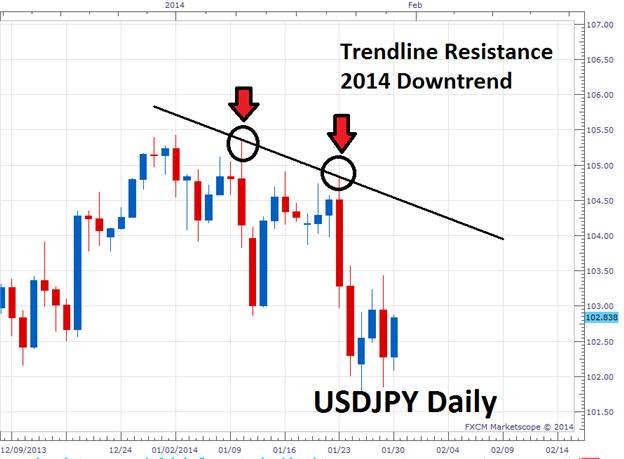
The 3 Step Retracement Strategy (adapted from dailyfx article)
- Retracements are pullbacks within a trend.
- Find the trend and resistance using trendlines.
- Entries can be planned using a Fibonacci retracement.
Find A Trendline
Before we can consider trading a pricing swing, we need to first be able
to find market direction as well as support or resistance. This issue
can be solved by creating a trendline. These areas can be found on a
chart by either connecting to highs or lows, then extrapolating their
direction on the chart. In a downtrend traders should look for price
action to be declining under trendline resistance, while in uptrend
prices should be advancing above trendline support.
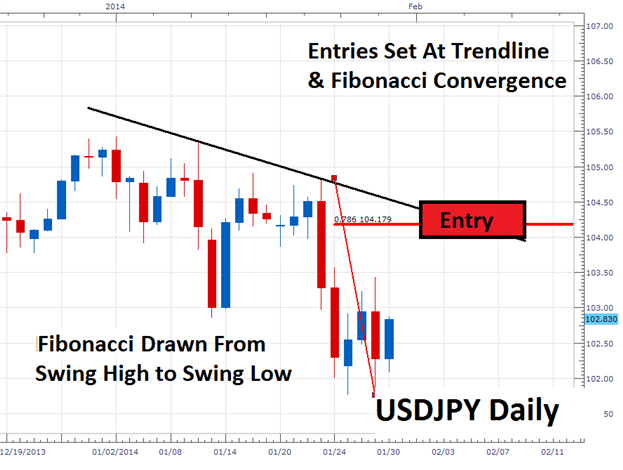
Fibonacci Retracements
Once market direction and trendline resistance is identified, we need to identify an area to enter into the market. This can be done by finding a confluence of resistance using a Fibonacci retracement. These retracement values are displayed as a percentage of the previous move as measured from swing high/low in a downtrend. Much like our previously drawn trendline, these retracements can pinpoint areas where the market may turn. Traders should look to see where these two values converge and then plan to enter the market.
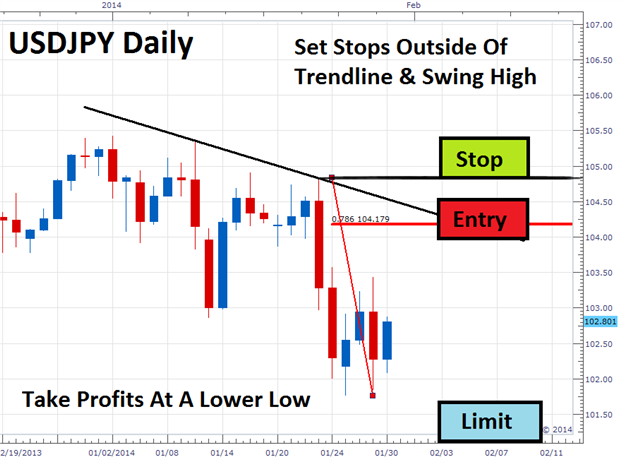
Exiting Positions
Now that we have a plan to enter the market on a price swing, traders will need to identify when it is time to exit the market. This is always the third and final step of any successful strategy! In order to manage risk, traders should first consider where to set a stop order. In a downtrend like the USDJPY daily chart, traders should consider placing this value above resistance. On the chart below stop orders have been placed outside of resistance, above our current trendline and previous swing high.
Forum on trading, automated trading systems and testing trading strategies
Something Interesting to Read January 2014
Sergey Golubev, 2014.01.13 06:04
Fibonacci Trading: How to Master the Time and Price Advantage: Carolyn Boroden

Product Description :
Made famous by the Italian mathematician Leonardo De Pisa, the Fibonacci
number series holds a Golden Ratio that is universally found in nature
and used by architects, plastic surgeons, and many others to achieve
“perfect” aesthetic proportions. Now, in this groundbreaking guide,
noted technical trading advisor Carolyn Boroden shows you how Fibonacci
pattern studies can be used as an extremely effective method for
achieving greater profitability in stocks, futures, and Forex markets.
Fibonacci Trading provides a one-stop resource of reliable tools and
clear explanations for both identifying and taking advantage of the
trade setups naturally occurring in the markets that will enable you to
reach the highest rate of profitable trades. Inside, you'll find a
unique trading methodology based on Fibonacci ratios, and the author's
personal experience analyzing and setting up the markets in real time,
which makes this practical volume invaluable to the self-directed
investor.
Complete with detailed charts and insightful graphics in each chapter, Fibonacci Trading features:
- Dependable guidance for determining important support and resistance levels, along with expert advice for using them to maximize profits and limit losses
- Step-by-step processes for using Fibonacci analysis to predict turning points in the market far enough in advance to generate substantial profit
- Valuable tips for using Fibonacci analysis to establish optimal stop-loss placement
- Revealing coverage on how Fibonacci relationships can create a roadmap for the trader based on high percentage patterns
Fibonacci Trading also provides a four-step formula for applying the
covered techniques in a highly effective approach. Flexible enough for
all markets and trading styles, the formula helps you focus your newly
developed knowledge and skill sets into a solid trading methodology,
defined trading plan, successful trading mindset, and disciplined
trading approach that stacks the odds for profit in your favor.
This hands-on guide is packed with a wealth of actual trading
situations, setups, and scenarios that bring the four-step formula to
life so you can immediately use it in the real world.
- Free trading apps
- Over 8,000 signals for copying
- Economic news for exploring financial markets
You agree to website policy and terms of use
learning how working with fibonancy and support resistance