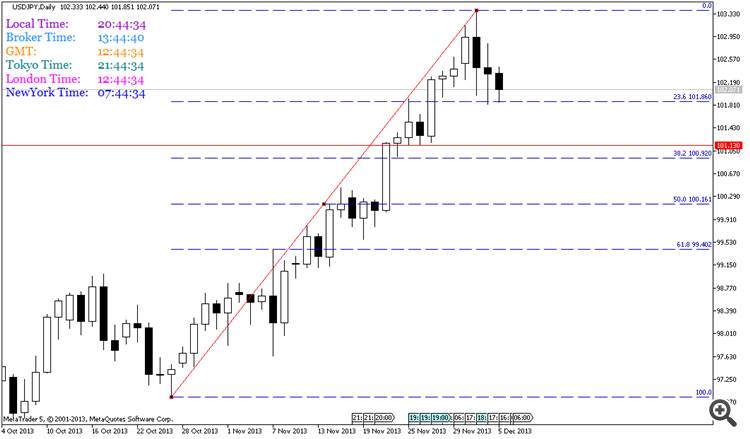
From my observation, USDJPY daily chart, this currency pair now testing the support fibo level 23.6% @101.86. If this level can't hold it, the next support level 101.13 which is tested 3 times end of November.
You are missing trading opportunities:
- Free trading apps
- Over 8,000 signals for copying
- Economic news for exploring financial markets
Registration
Log in
You agree to website policy and terms of use
If you do not have an account, please register

Hello everyone, I found here this interessting formation. 101.9 was tested a few times, and I think that if a candle closes under this line we would get a good short position.
I expect that the price will reach 100.6