Something Interesting in Financial Video December 2013 - page 6
You are missing trading opportunities:
- Free trading apps
- Over 8,000 signals for copying
- Economic news for exploring financial markets
Registration
Log in
You agree to website policy and terms of use
If you do not have an account, please register
How to Use the Accumulation/Distribution Momentum Indicator
Forum on trading, automated trading systems and testing trading strategies
Indicators: Accumulation/Distribution
newdigital, 2013.12.29 05:45
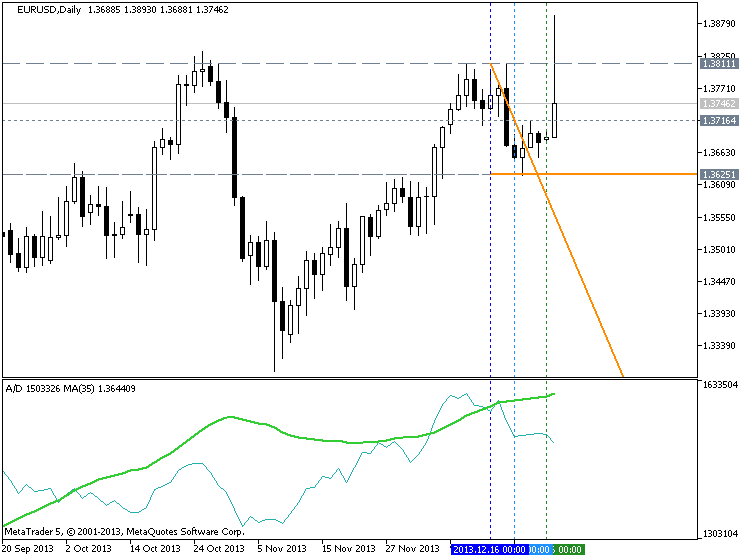
Accumulation Distribution uses volume to confirm price trends or warn of weak movements that could result in a price reversal.
Therefore, when a day is an accumulation day, the day's volume is added to the previous day's Accumulation Distribution Line. Similarly, when a day is a distribution day, the day's volume is subtracted from the previous day's Accumulation Distribution Line.
The main use of the Accumulation Distribution Line is to detect divergences between the price movement and volume movement. An example of the Accumulation Distribution Line is shown below in the chart of the Nasdaq 100 exchange traded fund QQQQ:
Volume InterpretationThe basic interpretation of volume goes as follows:
For more in-depth analysis of Volume.
High #1 to High #2The Nasdaq 100 made an equal high at High #2; however, the Accumulation Distribution Line failed to make an equal high, in fact it made a lower high. On average, less volume was transacted on the move higher at High #2 than occured on the first move higher at High #1; thus, this could be interpreted as there being less strength and conviction behind the rally in the Nasdaq the second move higher. This failure of the Accumulation Distribution Line signaled a strong bearish divergence.
High #3 to High #4Again, the Accumulation Distribution line made a lower high, even though the Nasdaq 100 this time made a higher high. This bearish divergence warned that the second move to make a higher high in price lacked conviction.
Low #1 to Low #2The bearish divergence from Low #1 to Low #2 confirmed the later bearish divergence of High #3 to High #4. On average, more volume was occuring on down days than up days, even while the Nasdaq 100 was making higher highs and higher lows, which usually is considered a sign of strength.
In summary, the Accumulation Distribution Line is a very effective tool to confirm price action and show warnings of potential price reversals. It is important to incorporate volume into price analysis, and the Accumulation Distribution Line is one of many indicators to do just this. Other indicators that include price and volume analysis and could be considered more accurate than the Accumulation Distribution Line include the Chaikin Oscillator, Money Flow Index, and Price Volume Trend indicator.
Forum on trading, automated trading systems and testing trading strategies
Indicators: Accumulation/Distribution
newdigital, 2013.12.29 05:53
One Indicator Stock Traders Must Follow
Most stock investors spend a lot of time using technical or fundamental analysis to pick the best stock, ETF, or fund to buy. Less time is spent on doing equally rigorous analysis of the market’s trend, and too often their conclusions are based on a fundamental opinion of the economy. The majority of technical analysts, of course, will tell you that the fundamental data badly lags the price action.
In March 2009, it was almost impossible to have a positive fundamental view of the economy. As I will show you later, there were clear technical signs at the time that the stock market was indeed bottoming. In this article, I will focus on the one indicator that is often ignored by many, but that should be followed closely by all stock investors.
While there are always some stocks that will rise when the major averages are declining, going against the major trend is generally never a good idea. By determining the market’s internal strength or weakness, you will be able to make a more reasoned decision to buy or sell, and this should make your investing more successful.
The best way to measure the market’s health is through the Advance/Decline line, or A/D line. The most important A/D line is based on the NYSE Composite. It is calculated daily by determining the number of stocks that are up (advancing) and the number of stocks that are down (declining). The A/D line is a then-cumulative total of the number of advancing minus the number of declining stocks.
In many years of study, I have found that the A/D line is the most effective tool for identifying market bottoms. In this article, I will show you how I use support, resistance, trend line analysis, and moving averages to determine the market’s trend using the A/D line. Of course, these patterns are rarely exactly the same, but through these examples, you should be well-prepared for most future scenarios.
This chart, courtesy of Tradestation.com, covers the period from November 2004 through November 2005 and is a ideal example of how the A/D line can identify a market low. On the bottom of the chart in blue is the A/D line with a 34-period exponential moving average (EMA) of the A/D line in pink.
From the NYSE Composite’s March high of 7453, the market retreated sharply and violated four-month support, line a, in April. This created significant overhead resistance, as anyone who bought since November was now at a loss.
The NYSE made lower lows in April and May (line b), consistent with a weak market. The NYSE A/D line was giving a different picture, as it formed higher lows, line c. A bullish or positive divergence is not always seen at market lows, but when it is, that signal is highly reliable.
It is important to note that the A/D line was acting stronger than prices, and while the NYSE was at 7124 and still well below the April high at 7222 (line e), the A/D line was higher.
The NYSE Composite did not overcome its resistance until 17 trading days after the A/D line. Though this may seem rather surprising, this is a rather common occurrence with the A/D line.
Over the next three months, the A/D line was rising steadily, but on August 12, it failed to make a new high with prices (point 2). This was the first warning signal.
The NYSE Composite made further new highs on September 9 at 7665 (point 3), but the A/D line failed to make new highs, forming a negative divergence, line f. This divergence was completed on September 20 when support at line g was broken. This was 11 days before the important chart support at line h was broken.
The Hook Reversal - Part 6 of a video series discussing short term price bar reversals such as the bearish rejection, the bullish rejection, the open close reversal, the closing price reversal, the hook reversal, the key reversal, the island reversal and the pivot point reversal.
Extreme Bollinger Band reversal are so easy to trade as long as you follow the rules in this video. Make sure that you wait for all the time frames to hit the Bollinger Band and wait for the m5 time frame to show you a flat side before you trade in the opposite direction.
Forum on trading, automated trading systems and testing trading strategies
Indicators: Bollinger Bands ®
newdigital, 2013.08.06 14:04
Bollinger Bands Trend Reversals- Double Tops and Double Bottoms
A Forex trader should wait for the price to turn in the opposite direction after touching one of the bands before considering that a reversal is happening.
Even better one should see the price cross over the moving average.
Double Bottoms Trend Reversals
A double bottom is a buy setup/signal. It occurs when price action penetrates the lower bollinger band then rebounds forming the first low. then after a while another low is formed, and this time it is above the lower band.
The second low must not be lower than the first one and it important is that the second low does not touch or penetrate the lower band. This bullish Forex trading setup is confirmed when the price action moves and closes above the middle band (simple moving average).
Double Tops Trend Reversals
A double top is a sell setup/signal. It occurs when price action penetrates the upper bollinger band then rebounds down forming the first high. then after a while another high is formed, and this time it is below the upper band.
The second high must not be higher than the first one and it important is that the second high does not touch or penetrate the upper band. This bearish Forex trading setup is confirmed when the price action moves and closes below the middle band (simple moving average).
Moving Averages - How to Use Them and Which Ones to Use by Toni Hansen
Forum on trading, automated trading systems and testing trading strategies
Indicators: Custom Moving Average
newdigital, 2013.07.30 20:18
Types of Moving Averages SMA, EMA, LWMA and SMMAThere are 4 types of moving averages:
- Simple moving average
- Exponential moving average
- Smoothed moving average
- Linear weighted moving average
The difference between these 4 moving averages is the weight assigned in to the most recent price data.Simple Moving Average - SMA
Simple moving averages apply equal weight to the prices used to calculate the average
Simple moving average is calculated by summing up the price periods of a financial instrument and this value is then divided by the number of such periods. For example simple moving average 10, adds price for the last 10 periods and divides them by 10.
Exponential Moving Average - EMA
Exponential moving averages apply more weight to the most recent price data.
Exponential moving averages are calculated by assigning the latest price values more weight based on a percent P, multiplier that is used to multiply and assign more weight to the latest price data.
Linear Weighted Moving Average - LWMA
Linear weighted moving averages apply more weight to the most recent price data.
Linear weighted moving average - the latest data is of more value than earlier data. Weighted moving average is calculated by multiplying each of the closing prices within the price series, by a certain weight coefficient.
Smoothed moving average - SMMA
The smoothed moving average is calculated by applying a smoothing factor of N, the smoothing factor is composed of N smoothing periods.
The example below shows SMA, EMA and LWMA. The smoothed moving average is not commonly used so it is not shown below.
The Linear weighted moving average reacts fastest to price data, followed by the exponential moving average and then the SMA.
Day Trading with Exponential moving averages and simple moving averages
The moving averages most commonly used are simple moving average (SMA) and more and exponential moving average (EMA). Whereas the EMA has a more sophisticated method of calculation, its more popular than the SMA moving average.
SMA is the arithmetic mean of the closing prices in the period based on the set time period where each time period the price is added and then it is divided by the number of time periods chosen. If 10 is the period used the price for the last ten periods added up then it is divided by 10.
SMA is the result of a simple arithmetic average. Very simple and some forex traders tend to associate with the forex trend since it closely follows price action.
EMA on the other hand uses an acceleration factor and it is more responsive to the trend.
The SMA is used in price charts to analyze price action relative to the SMA. If the price action in more than 3 or 4 time periods show below the SMA then its an indication that long trades should be closed immediately and the bullish momentum is waning.
The shorter the SMA Price action period the faster the SMA is to respond to price change. SMA can be used to show direct information regarding the trend of the market and the strength by looking at the slope of the SMA, the steeper or more pronounced slope display is, the stronger the forex trend.
The EMA is also used by many traders in the same way as the SMA but it reacts faster to price action and therefore preferred by some traders.
The SMA and EMA can also be used to generate entry and exit points. These Moving averages can also be combined with Fibonacci and ADX indicator to generate confirmation signals. Most day traders use 5- 10 period moving average.
A new series which covers how to use the Metatrader 4 platform to trade the forex market.