The unprecision of trendlines, how to avoid that?
If you draw a trendline to anchor to the low of the 04:00 candle on the H4 chart. You have to remember that you have drawn it at 04:00, but the low could have occurred at any time during the 4 hour life of the candle.
When you switch to the M5 chart, the trendline is still anchored at 04:00 even though the low may have occurred at 06:00.
You will need to check for the low on the M5 chart between 04:00 up to and including 07:55 and re-anchor the line. This can be done either manually or by writing the code to do it.
GumRai:
I dont understand your answer... if the low in the 5 min TF is lower than low in 4H TF, it should become the new 4H low ?
why the low represented in the 5 min chart isn't the lowest low of any bar in the 4H chart ?
to me your answer doesn't explain why this is happening.. maybe the answer is easy to find and it is just not poping up for me, but your answer isn't complete/
Nowhere in my reply did I say that the low on the M5 chart is lower than on the H4.
Read my reply again carefully
If you draw a trendline to anchor to the low of the 04:00 candle on the H4 chart. You have to remember that you have drawn it at 04:00, but the low could have occurred at any time during the 4 hour life of the candle.
When you switch to the M5 chart, the trendline is still anchored at 04:00 even though the low may have occurred at 06:00.
You will need to check for the low on the M5 chart between 04:00 up to and including 07:55 and re-anchor the line. This can be done either manually or by writing the code to do it.
GumRai: i understand what you mean, but if trend line is below 4h low, on a 5 min chart this same trend line must be under any low because the 4h low happened on one of that five min low thanks for your help, not my topic but very interested but the subject

Look at the trendline on the H4 chart using 2 consecutive lows
Then switch to M5
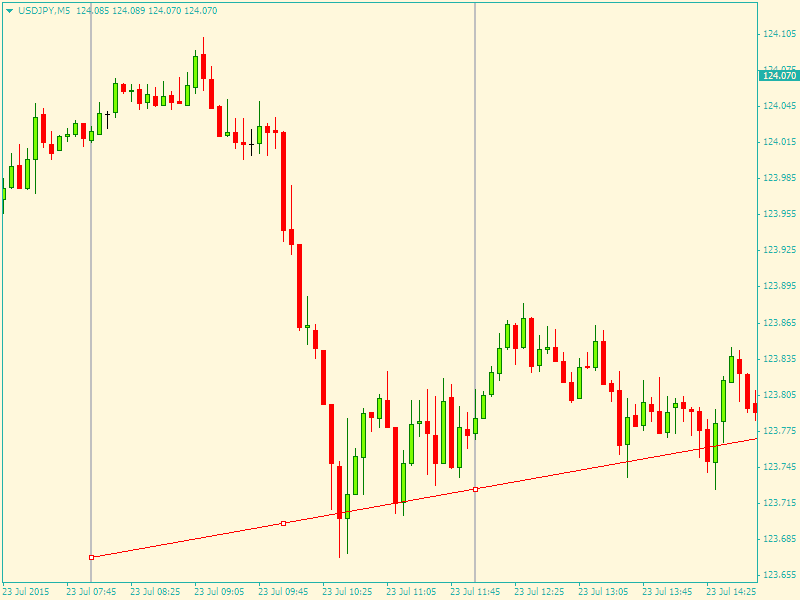
The H4 trendline is anchored at 08:00 and 12:00
but on the M5, the lows are at 10:35 and 14:30
but the time anchor is the same as the H4 chart
so on the M5, the 1st anchor point is 08:00 with the price from 10:35
The 2nd is 12:00 with the price from 14:30
So the price is correct for both anchors, but the time anchors are incorrect
The reason being that there are no 10:35 or 14:30 candles on the H4 chart
Very good explanation, GumRai. Thank you!
I already made a test-script which places the lines to their corresponding bar on a lower timeframe. But the problem is that most of the time there is not enough data on the lower timeframes. Especially when you draw a weekly trendline. Often I can only re-fine it to a H4 bar instead of M5. I think I will check with iBarShift which timeframe has enough data which I can use and then I use the smallest one possible. Assuming I can re-fine OBJPROP_TIME1 to H1 and OBJPROP_TIME2 to M5 with my data history. Would you use H1 for TIME1 and M5 for TIME2 or would you use H1 for both?
Would you use H1 for TIME1 and M5 for TIME2 or would you use H1 for both?
- Free trading apps
- Over 8,000 signals for copying
- Economic news for exploring financial markets
You agree to website policy and terms of use
Hi all,
I noticed that even if I use fixed price points to draw a trendline, going to the lower timeframes could result in a mess.
Here you can see a trendline I drew on the H4 chart. You can clearly see which points I used to draw it. The "problem-area" is marked with a yellow box:
Now the same chart on the H1 timeframe. The reaction off the trendline in the marked box is still as expected:
Now the M15 chart. Still everything ok:
And now the M5 chart:
Here you see that the price broke the trendline and even traded a longer time below it. And this is not just a few pips. The low is about 25 pips under the trendline. How can it be that an M15 and an M5 chart are so different? And is it somehow possible to avoid that? My strategy is based on higher timeframe levels and trendlines and switch to a lower timeframe for the entry. But when MT4 works like this I can't use that.
Any ideas or suggestions?